Danish vs Immigrants from West Indies Vision Disability
COMPARE
Danish
Immigrants from West Indies
Vision Disability
Vision Disability Comparison
Danes
Immigrants from West Indies
2.1%
VISION DISABILITY
94.2/ 100
METRIC RATING
107th/ 347
METRIC RANK
2.3%
VISION DISABILITY
0.6/ 100
METRIC RATING
244th/ 347
METRIC RANK
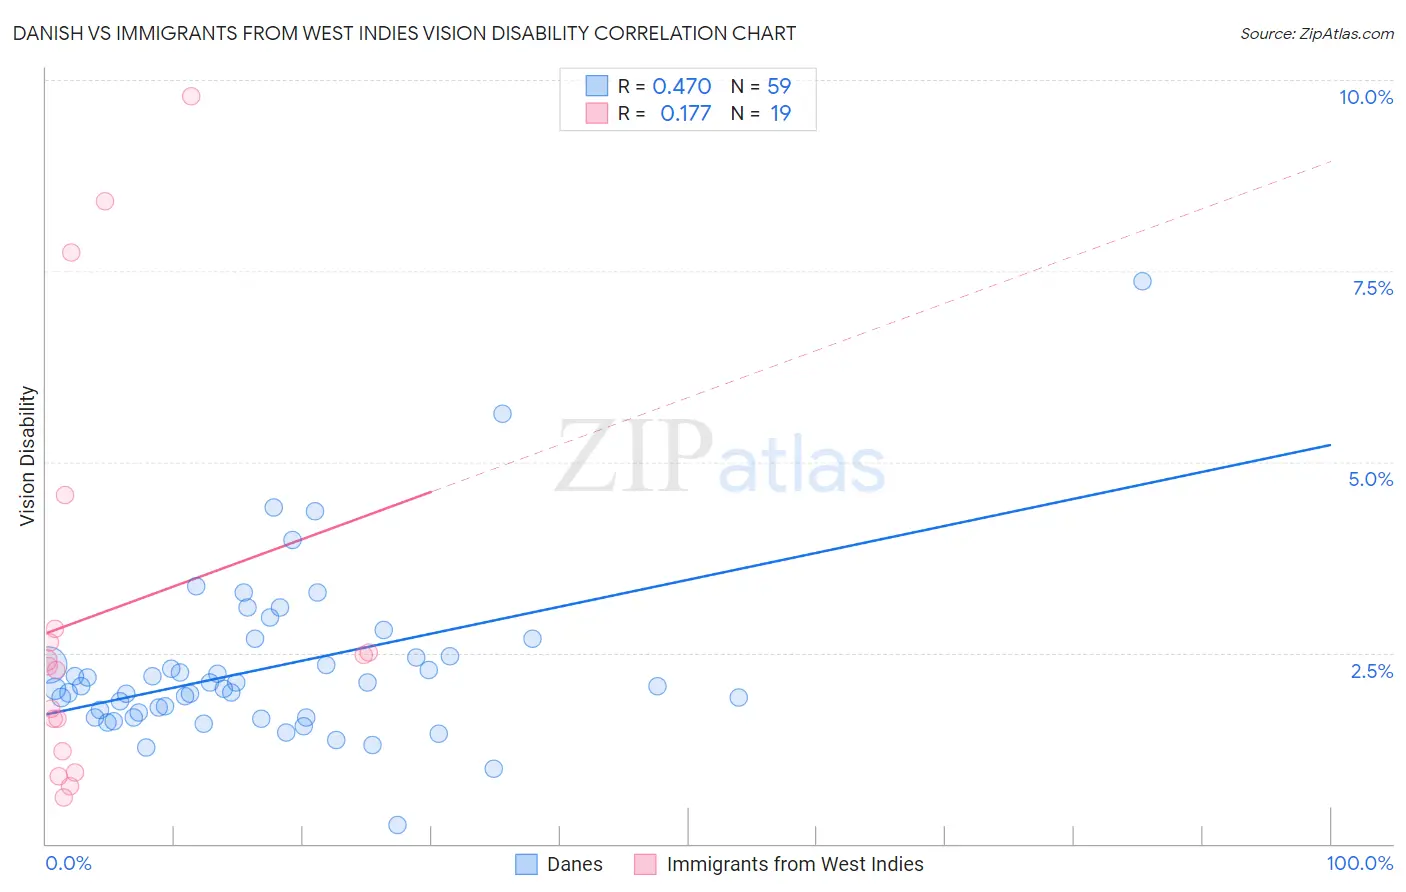
Danish vs Immigrants from West Indies Vision Disability Correlation Chart
The statistical analysis conducted on geographies consisting of 473,415,452 people shows a moderate positive correlation between the proportion of Danes and percentage of population with vision disability in the United States with a correlation coefficient (R) of 0.470 and weighted average of 2.1%. Similarly, the statistical analysis conducted on geographies consisting of 72,450,769 people shows a poor positive correlation between the proportion of Immigrants from West Indies and percentage of population with vision disability in the United States with a correlation coefficient (R) of 0.177 and weighted average of 2.3%, a difference of 13.0%.
Vision Disability Correlation Summary
| Measurement | Danish | Immigrants from West Indies |
| Minimum | 0.25% | 0.61% |
| Maximum | 7.4% | 9.8% |
| Range | 7.1% | 9.2% |
| Mean | 2.3% | 3.0% |
| Median | 2.1% | 2.3% |
| Interquartile 25% (IQ1) | 1.7% | 1.2% |
| Interquartile 75% (IQ3) | 2.5% | 2.8% |
| Interquartile Range (IQR) | 0.80% | 1.6% |
| Standard Deviation (Sample) | 1.1% | 2.7% |
| Standard Deviation (Population) | 1.1% | 2.6% |
Similar Demographics by Vision Disability
Demographics Similar to Danes by Vision Disability
In terms of vision disability, the demographic groups most similar to Danes are Swedish (2.1%, a difference of 0.010%), Korean (2.1%, a difference of 0.030%), Carpatho Rusyn (2.1%, a difference of 0.050%), Chilean (2.1%, a difference of 0.050%), and Immigrants from Italy (2.1%, a difference of 0.060%).
| Demographics | Rating | Rank | Vision Disability |
| Greeks | 95.1 /100 | #100 | Exceptional 2.1% |
| Albanians | 94.9 /100 | #101 | Exceptional 2.1% |
| Sri Lankans | 94.8 /100 | #102 | Exceptional 2.1% |
| Immigrants | Austria | 94.4 /100 | #103 | Exceptional 2.1% |
| Immigrants | Italy | 94.4 /100 | #104 | Exceptional 2.1% |
| Carpatho Rusyns | 94.3 /100 | #105 | Exceptional 2.1% |
| Swedes | 94.2 /100 | #106 | Exceptional 2.1% |
| Danes | 94.2 /100 | #107 | Exceptional 2.1% |
| Koreans | 94.1 /100 | #108 | Exceptional 2.1% |
| Chileans | 94.0 /100 | #109 | Exceptional 2.1% |
| Immigrants | Armenia | 93.8 /100 | #110 | Exceptional 2.1% |
| Peruvians | 93.5 /100 | #111 | Exceptional 2.1% |
| Immigrants | Denmark | 92.9 /100 | #112 | Exceptional 2.1% |
| Kenyans | 92.5 /100 | #113 | Exceptional 2.1% |
| Croatians | 92.3 /100 | #114 | Exceptional 2.1% |
Demographics Similar to Immigrants from West Indies by Vision Disability
In terms of vision disability, the demographic groups most similar to Immigrants from West Indies are Immigrants from Nicaragua (2.3%, a difference of 0.0%), Alsatian (2.3%, a difference of 0.090%), French (2.3%, a difference of 0.24%), Guatemalan (2.3%, a difference of 0.28%), and Subsaharan African (2.3%, a difference of 0.30%).
| Demographics | Rating | Rank | Vision Disability |
| Immigrants | Portugal | 1.4 /100 | #237 | Tragic 2.3% |
| Immigrants | Cambodia | 1.1 /100 | #238 | Tragic 2.3% |
| English | 1.1 /100 | #239 | Tragic 2.3% |
| Panamanians | 0.9 /100 | #240 | Tragic 2.3% |
| Malaysians | 0.9 /100 | #241 | Tragic 2.3% |
| Immigrants | Panama | 0.8 /100 | #242 | Tragic 2.3% |
| Immigrants | Nicaragua | 0.6 /100 | #243 | Tragic 2.3% |
| Immigrants | West Indies | 0.6 /100 | #244 | Tragic 2.3% |
| Alsatians | 0.6 /100 | #245 | Tragic 2.3% |
| French | 0.5 /100 | #246 | Tragic 2.3% |
| Guatemalans | 0.5 /100 | #247 | Tragic 2.3% |
| Sub-Saharan Africans | 0.5 /100 | #248 | Tragic 2.3% |
| Liberians | 0.5 /100 | #249 | Tragic 2.3% |
| Bangladeshis | 0.5 /100 | #250 | Tragic 2.3% |
| Immigrants | Laos | 0.4 /100 | #251 | Tragic 2.4% |