Immigrants from Bolivia vs Immigrants from Hungary Hearing Disability
COMPARE
Immigrants from Bolivia
Immigrants from Hungary
Hearing Disability
Hearing Disability Comparison
Immigrants from Bolivia
Immigrants from Hungary
2.5%
HEARING DISABILITY
99.8/ 100
METRIC RATING
20th/ 347
METRIC RANK
3.1%
HEARING DISABILITY
12.5/ 100
METRIC RATING
209th/ 347
METRIC RANK
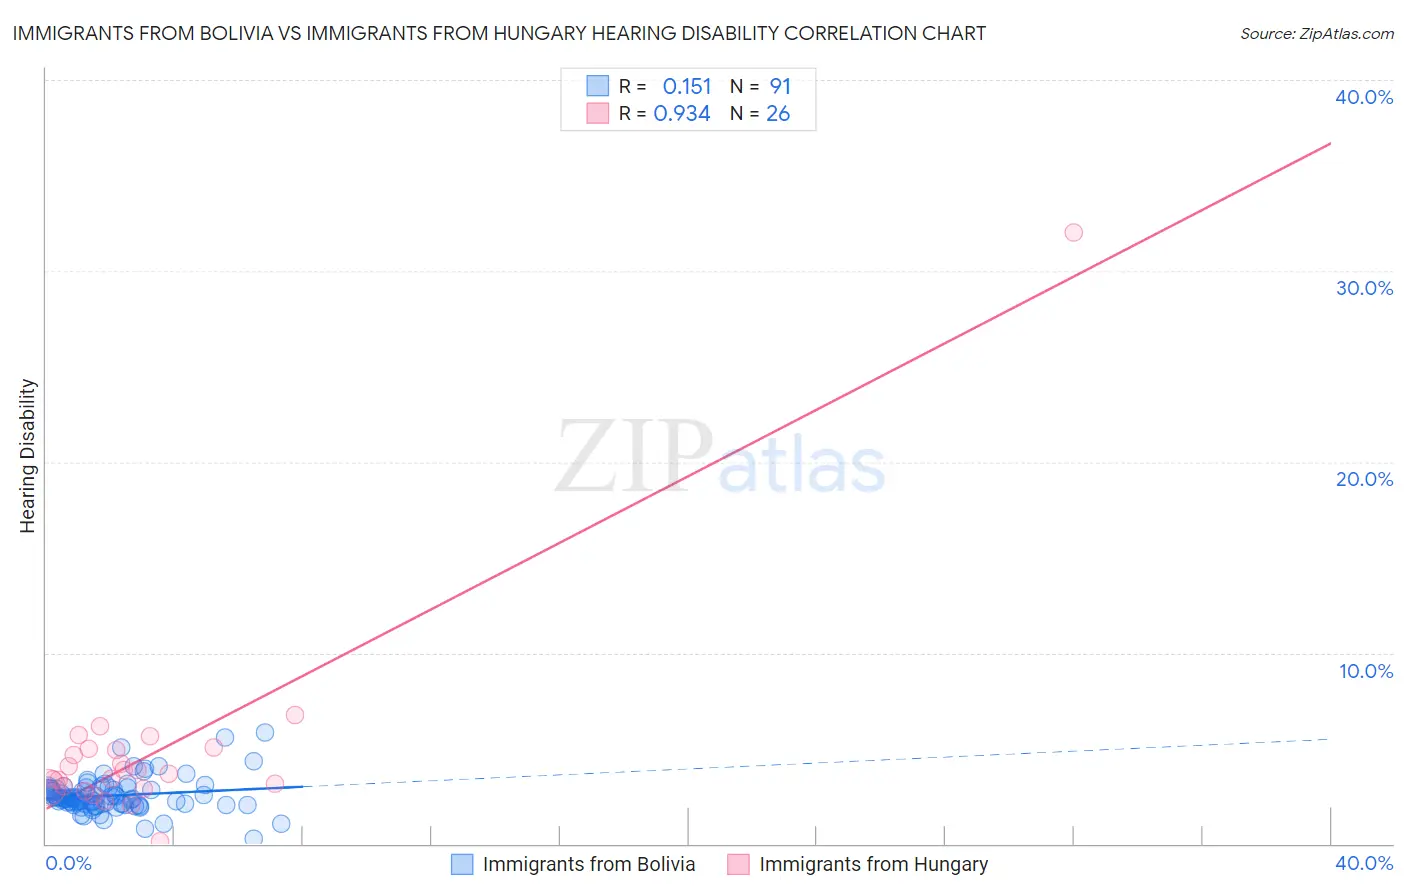
Immigrants from Bolivia vs Immigrants from Hungary Hearing Disability Correlation Chart
The statistical analysis conducted on geographies consisting of 158,707,824 people shows a poor positive correlation between the proportion of Immigrants from Bolivia and percentage of population with hearing disability in the United States with a correlation coefficient (R) of 0.151 and weighted average of 2.5%. Similarly, the statistical analysis conducted on geographies consisting of 195,680,611 people shows a near-perfect positive correlation between the proportion of Immigrants from Hungary and percentage of population with hearing disability in the United States with a correlation coefficient (R) of 0.934 and weighted average of 3.1%, a difference of 22.9%.
Hearing Disability Correlation Summary
| Measurement | Immigrants from Bolivia | Immigrants from Hungary |
| Minimum | 0.24% | 0.15% |
| Maximum | 5.8% | 32.0% |
| Range | 5.6% | 31.9% |
| Mean | 2.5% | 4.9% |
| Median | 2.4% | 3.8% |
| Interquartile 25% (IQ1) | 2.1% | 2.9% |
| Interquartile 75% (IQ3) | 2.9% | 5.0% |
| Interquartile Range (IQR) | 0.79% | 2.0% |
| Standard Deviation (Sample) | 0.88% | 5.7% |
| Standard Deviation (Population) | 0.87% | 5.6% |
Similar Demographics by Hearing Disability
Demographics Similar to Immigrants from Bolivia by Hearing Disability
In terms of hearing disability, the demographic groups most similar to Immigrants from Bolivia are Thai (2.5%, a difference of 0.050%), Dominican (2.5%, a difference of 0.070%), Ghanaian (2.5%, a difference of 0.070%), Immigrants from Sierra Leone (2.6%, a difference of 0.11%), and Immigrants from Nigeria (2.6%, a difference of 0.61%).
| Demographics | Rating | Rank | Hearing Disability |
| Sierra Leoneans | 99.9 /100 | #13 | Exceptional 2.5% |
| Ecuadorians | 99.9 /100 | #14 | Exceptional 2.5% |
| Barbadians | 99.9 /100 | #15 | Exceptional 2.5% |
| Immigrants | West Indies | 99.9 /100 | #16 | Exceptional 2.5% |
| Immigrants | India | 99.9 /100 | #17 | Exceptional 2.5% |
| Dominicans | 99.8 /100 | #18 | Exceptional 2.5% |
| Thais | 99.8 /100 | #19 | Exceptional 2.5% |
| Immigrants | Bolivia | 99.8 /100 | #20 | Exceptional 2.5% |
| Ghanaians | 99.8 /100 | #21 | Exceptional 2.5% |
| Immigrants | Sierra Leone | 99.8 /100 | #22 | Exceptional 2.6% |
| Immigrants | Nigeria | 99.8 /100 | #23 | Exceptional 2.6% |
| Immigrants | Ghana | 99.8 /100 | #24 | Exceptional 2.6% |
| Immigrants | El Salvador | 99.7 /100 | #25 | Exceptional 2.6% |
| Immigrants | Senegal | 99.7 /100 | #26 | Exceptional 2.6% |
| Immigrants | South Central Asia | 99.7 /100 | #27 | Exceptional 2.6% |
Demographics Similar to Immigrants from Hungary by Hearing Disability
In terms of hearing disability, the demographic groups most similar to Immigrants from Hungary are Immigrants from Latvia (3.1%, a difference of 0.040%), Cape Verdean (3.1%, a difference of 0.050%), Romanian (3.1%, a difference of 0.080%), Pakistani (3.1%, a difference of 0.29%), and Immigrants from Iraq (3.1%, a difference of 0.44%).
| Demographics | Rating | Rank | Hearing Disability |
| Immigrants | Thailand | 16.4 /100 | #202 | Poor 3.1% |
| Immigrants | Denmark | 16.2 /100 | #203 | Poor 3.1% |
| Immigrants | Czechoslovakia | 15.9 /100 | #204 | Poor 3.1% |
| Alsatians | 15.9 /100 | #205 | Poor 3.1% |
| Eastern Europeans | 15.5 /100 | #206 | Poor 3.1% |
| Hispanics or Latinos | 15.1 /100 | #207 | Poor 3.1% |
| Immigrants | Latvia | 12.7 /100 | #208 | Poor 3.1% |
| Immigrants | Hungary | 12.5 /100 | #209 | Poor 3.1% |
| Cape Verdeans | 12.2 /100 | #210 | Poor 3.1% |
| Romanians | 12.1 /100 | #211 | Poor 3.1% |
| Pakistanis | 11.1 /100 | #212 | Poor 3.1% |
| Immigrants | Iraq | 10.5 /100 | #213 | Poor 3.1% |
| Australians | 8.1 /100 | #214 | Tragic 3.2% |
| Bangladeshis | 8.1 /100 | #215 | Tragic 3.2% |
| Immigrants | Norway | 7.3 /100 | #216 | Tragic 3.2% |