Moroccan vs Immigrants from Europe 8th Grade
COMPARE
Moroccan
Immigrants from Europe
8th Grade
8th Grade Comparison
Moroccans
Immigrants from Europe
95.5%
8TH GRADE
17.4/ 100
METRIC RATING
203rd/ 347
METRIC RANK
96.2%
8TH GRADE
95.3/ 100
METRIC RATING
122nd/ 347
METRIC RANK
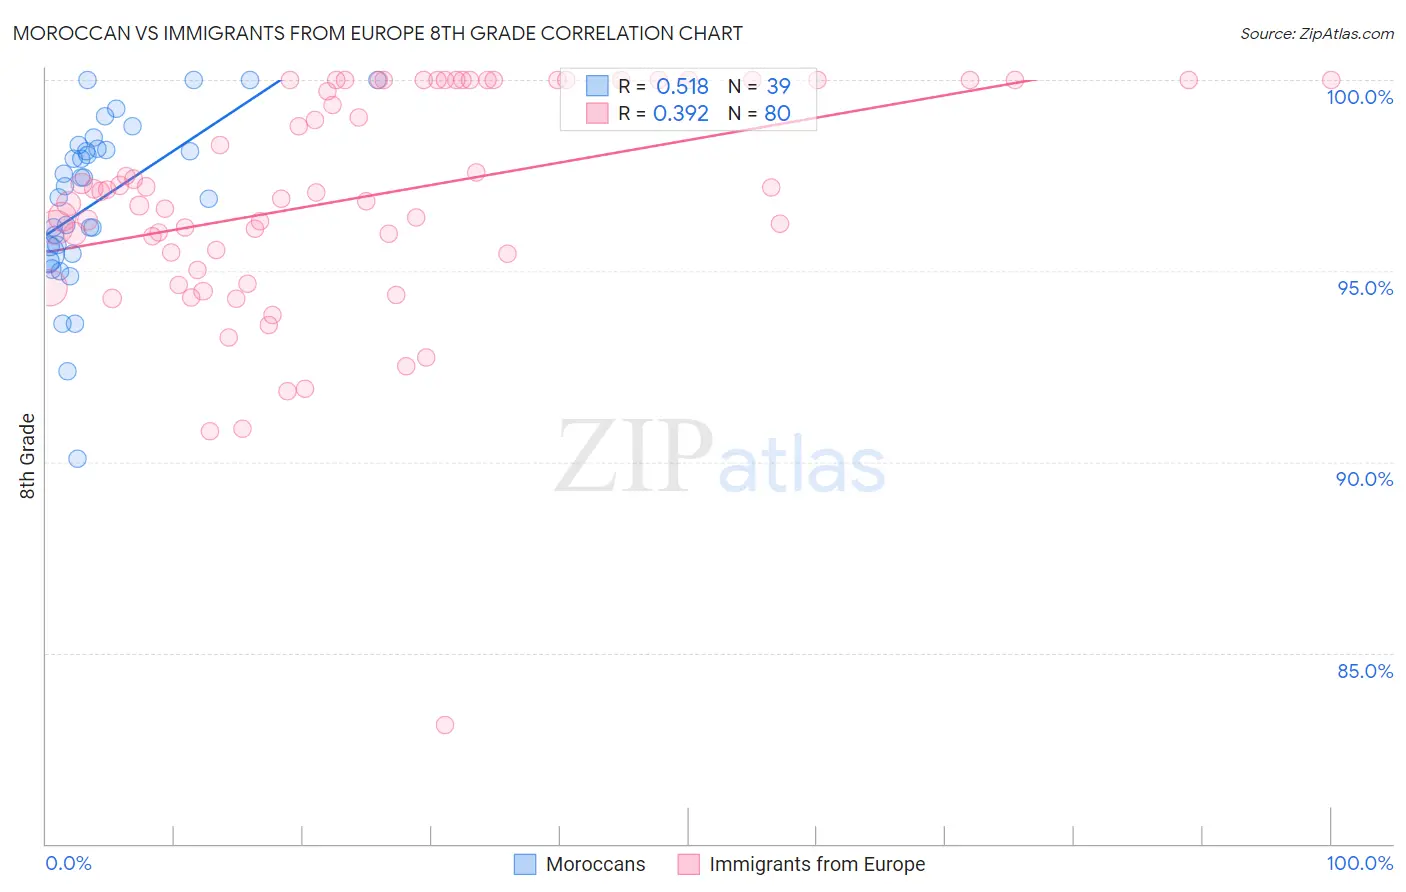
Moroccan vs Immigrants from Europe 8th Grade Correlation Chart
The statistical analysis conducted on geographies consisting of 201,817,667 people shows a substantial positive correlation between the proportion of Moroccans and percentage of population with at least 8th grade education in the United States with a correlation coefficient (R) of 0.518 and weighted average of 95.5%. Similarly, the statistical analysis conducted on geographies consisting of 547,425,973 people shows a mild positive correlation between the proportion of Immigrants from Europe and percentage of population with at least 8th grade education in the United States with a correlation coefficient (R) of 0.392 and weighted average of 96.2%, a difference of 0.74%.
8th Grade Correlation Summary
| Measurement | Moroccan | Immigrants from Europe |
| Minimum | 90.1% | 83.1% |
| Maximum | 100.0% | 100.0% |
| Range | 9.9% | 16.9% |
| Mean | 96.8% | 96.9% |
| Median | 97.2% | 97.1% |
| Interquartile 25% (IQ1) | 95.5% | 95.5% |
| Interquartile 75% (IQ3) | 98.2% | 100.0% |
| Interquartile Range (IQR) | 2.7% | 4.5% |
| Standard Deviation (Sample) | 2.2% | 3.0% |
| Standard Deviation (Population) | 2.2% | 3.0% |
Similar Demographics by 8th Grade
Demographics Similar to Moroccans by 8th Grade
In terms of 8th grade, the demographic groups most similar to Moroccans are Hawaiian (95.5%, a difference of 0.010%), Immigrants from Bahamas (95.5%, a difference of 0.010%), Comanche (95.5%, a difference of 0.010%), Apache (95.5%, a difference of 0.020%), and Immigrants from Argentina (95.5%, a difference of 0.030%).
| Demographics | Rating | Rank | 8th Grade |
| Assyrians/Chaldeans/Syriacs | 24.5 /100 | #196 | Fair 95.6% |
| Sierra Leoneans | 24.3 /100 | #197 | Fair 95.6% |
| Paraguayans | 22.6 /100 | #198 | Fair 95.5% |
| Immigrants | Northern Africa | 22.5 /100 | #199 | Fair 95.5% |
| Argentineans | 22.2 /100 | #200 | Fair 95.5% |
| Immigrants | Argentina | 20.6 /100 | #201 | Fair 95.5% |
| Apache | 19.4 /100 | #202 | Poor 95.5% |
| Moroccans | 17.4 /100 | #203 | Poor 95.5% |
| Hawaiians | 16.7 /100 | #204 | Poor 95.5% |
| Immigrants | Bahamas | 16.7 /100 | #205 | Poor 95.5% |
| Comanche | 16.3 /100 | #206 | Poor 95.5% |
| Immigrants | Sudan | 15.1 /100 | #207 | Poor 95.5% |
| Portuguese | 14.3 /100 | #208 | Poor 95.5% |
| Immigrants | Lebanon | 13.7 /100 | #209 | Poor 95.4% |
| Africans | 13.6 /100 | #210 | Poor 95.4% |
Demographics Similar to Immigrants from Europe by 8th Grade
In terms of 8th grade, the demographic groups most similar to Immigrants from Europe are Immigrants from Switzerland (96.2%, a difference of 0.0%), Immigrants from France (96.2%, a difference of 0.0%), Immigrants from Bulgaria (96.2%, a difference of 0.0%), Immigrants from Norway (96.2%, a difference of 0.020%), and Filipino (96.2%, a difference of 0.020%).
| Demographics | Rating | Rank | 8th Grade |
| Immigrants | Moldova | 96.5 /100 | #115 | Exceptional 96.2% |
| Immigrants | Nonimmigrants | 96.0 /100 | #116 | Exceptional 96.2% |
| Immigrants | Croatia | 96.0 /100 | #117 | Exceptional 96.2% |
| Immigrants | Norway | 95.7 /100 | #118 | Exceptional 96.2% |
| Immigrants | Switzerland | 95.3 /100 | #119 | Exceptional 96.2% |
| Immigrants | France | 95.3 /100 | #120 | Exceptional 96.2% |
| Immigrants | Bulgaria | 95.3 /100 | #121 | Exceptional 96.2% |
| Immigrants | Europe | 95.3 /100 | #122 | Exceptional 96.2% |
| Filipinos | 94.6 /100 | #123 | Exceptional 96.2% |
| Palestinians | 94.6 /100 | #124 | Exceptional 96.2% |
| Immigrants | Romania | 94.1 /100 | #125 | Exceptional 96.2% |
| Choctaw | 94.0 /100 | #126 | Exceptional 96.2% |
| Immigrants | Serbia | 94.0 /100 | #127 | Exceptional 96.2% |
| Immigrants | Bosnia and Herzegovina | 93.9 /100 | #128 | Exceptional 96.2% |
| Cheyenne | 93.3 /100 | #129 | Exceptional 96.1% |