Maltese vs Immigrants from Uruguay Disability Age Over 75
COMPARE
Maltese
Immigrants from Uruguay
Disability Age Over 75
Disability Age Over 75 Comparison
Maltese
Immigrants from Uruguay
45.8%
DISABILITY AGE OVER 75
99.6/ 100
METRIC RATING
55th/ 347
METRIC RANK
46.4%
DISABILITY AGE OVER 75
96.7/ 100
METRIC RATING
107th/ 347
METRIC RANK
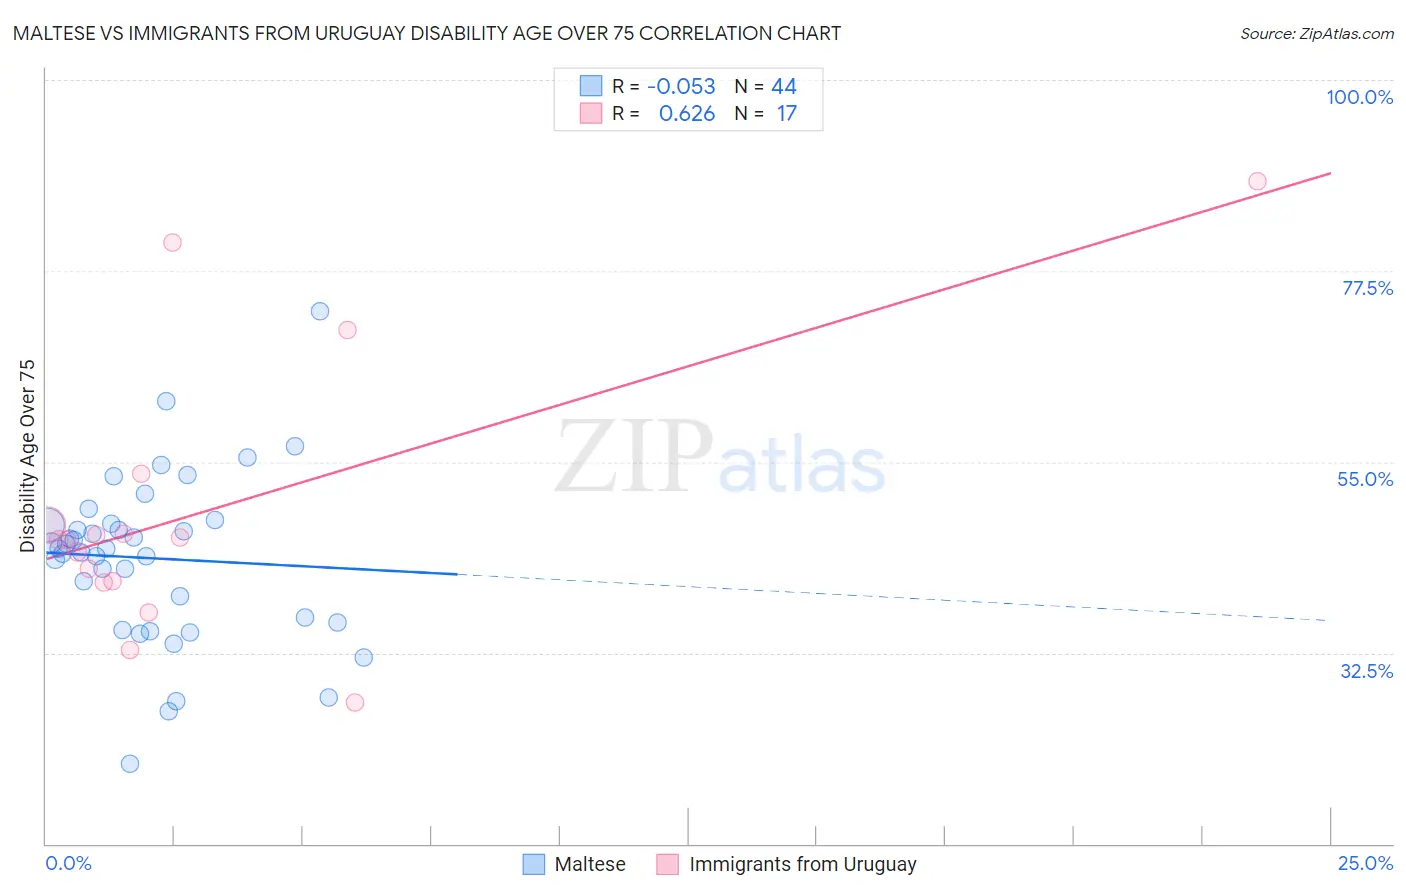
Maltese vs Immigrants from Uruguay Disability Age Over 75 Correlation Chart
The statistical analysis conducted on geographies consisting of 126,418,061 people shows a slight negative correlation between the proportion of Maltese and percentage of population with a disability over the age of 75 in the United States with a correlation coefficient (R) of -0.053 and weighted average of 45.8%. Similarly, the statistical analysis conducted on geographies consisting of 133,242,093 people shows a significant positive correlation between the proportion of Immigrants from Uruguay and percentage of population with a disability over the age of 75 in the United States with a correlation coefficient (R) of 0.626 and weighted average of 46.4%, a difference of 1.3%.
Disability Age Over 75 Correlation Summary
| Measurement | Maltese | Immigrants from Uruguay |
| Minimum | 19.4% | 26.7% |
| Maximum | 72.8% | 88.0% |
| Range | 53.3% | 61.3% |
| Mean | 43.6% | 49.2% |
| Median | 44.8% | 45.9% |
| Interquartile 25% (IQ1) | 36.4% | 40.9% |
| Interquartile 75% (IQ3) | 47.7% | 50.6% |
| Interquartile Range (IQR) | 11.3% | 9.7% |
| Standard Deviation (Sample) | 9.8% | 16.1% |
| Standard Deviation (Population) | 9.7% | 15.6% |
Similar Demographics by Disability Age Over 75
Demographics Similar to Maltese by Disability Age Over 75
In terms of disability age over 75, the demographic groups most similar to Maltese are Slovak (45.8%, a difference of 0.0%), Immigrants from Netherlands (45.9%, a difference of 0.070%), Immigrants from Italy (45.8%, a difference of 0.080%), Immigrants from Turkey (45.9%, a difference of 0.080%), and Immigrants from Israel (45.9%, a difference of 0.080%).
| Demographics | Rating | Rank | Disability Age Over 75 |
| Croatians | 99.8 /100 | #48 | Exceptional 45.7% |
| Immigrants | North America | 99.8 /100 | #49 | Exceptional 45.7% |
| Belgians | 99.7 /100 | #50 | Exceptional 45.8% |
| Immigrants | Korea | 99.7 /100 | #51 | Exceptional 45.8% |
| Immigrants | France | 99.7 /100 | #52 | Exceptional 45.8% |
| Immigrants | Italy | 99.7 /100 | #53 | Exceptional 45.8% |
| Slovaks | 99.6 /100 | #54 | Exceptional 45.8% |
| Maltese | 99.6 /100 | #55 | Exceptional 45.8% |
| Immigrants | Netherlands | 99.6 /100 | #56 | Exceptional 45.9% |
| Immigrants | Turkey | 99.6 /100 | #57 | Exceptional 45.9% |
| Immigrants | Israel | 99.6 /100 | #58 | Exceptional 45.9% |
| Iranians | 99.6 /100 | #59 | Exceptional 45.9% |
| Immigrants | Europe | 99.6 /100 | #60 | Exceptional 45.9% |
| Immigrants | Argentina | 99.6 /100 | #61 | Exceptional 45.9% |
| Burmese | 99.5 /100 | #62 | Exceptional 45.9% |
Demographics Similar to Immigrants from Uruguay by Disability Age Over 75
In terms of disability age over 75, the demographic groups most similar to Immigrants from Uruguay are Brazilian (46.5%, a difference of 0.010%), Immigrants from Kuwait (46.4%, a difference of 0.030%), Chilean (46.5%, a difference of 0.040%), Immigrants from Cameroon (46.4%, a difference of 0.050%), and Immigrants from Hong Kong (46.5%, a difference of 0.050%).
| Demographics | Rating | Rank | Disability Age Over 75 |
| Immigrants | Eastern Europe | 97.7 /100 | #100 | Exceptional 46.3% |
| Mongolians | 97.7 /100 | #101 | Exceptional 46.3% |
| Immigrants | Malaysia | 97.1 /100 | #102 | Exceptional 46.4% |
| Ukrainians | 97.1 /100 | #103 | Exceptional 46.4% |
| Israelis | 97.0 /100 | #104 | Exceptional 46.4% |
| Immigrants | Cameroon | 96.9 /100 | #105 | Exceptional 46.4% |
| Immigrants | Kuwait | 96.8 /100 | #106 | Exceptional 46.4% |
| Immigrants | Uruguay | 96.7 /100 | #107 | Exceptional 46.4% |
| Brazilians | 96.6 /100 | #108 | Exceptional 46.5% |
| Chileans | 96.4 /100 | #109 | Exceptional 46.5% |
| Immigrants | Hong Kong | 96.4 /100 | #110 | Exceptional 46.5% |
| Immigrants | Chile | 96.4 /100 | #111 | Exceptional 46.5% |
| Immigrants | Pakistan | 96.1 /100 | #112 | Exceptional 46.5% |
| Irish | 96.0 /100 | #113 | Exceptional 46.5% |
| Dutch | 95.9 /100 | #114 | Exceptional 46.5% |