Maltese vs Canadian Disability Age Over 75
COMPARE
Maltese
Canadian
Disability Age Over 75
Disability Age Over 75 Comparison
Maltese
Canadians
45.8%
DISABILITY AGE OVER 75
99.6/ 100
METRIC RATING
55th/ 347
METRIC RANK
46.6%
DISABILITY AGE OVER 75
94.4/ 100
METRIC RATING
119th/ 347
METRIC RANK
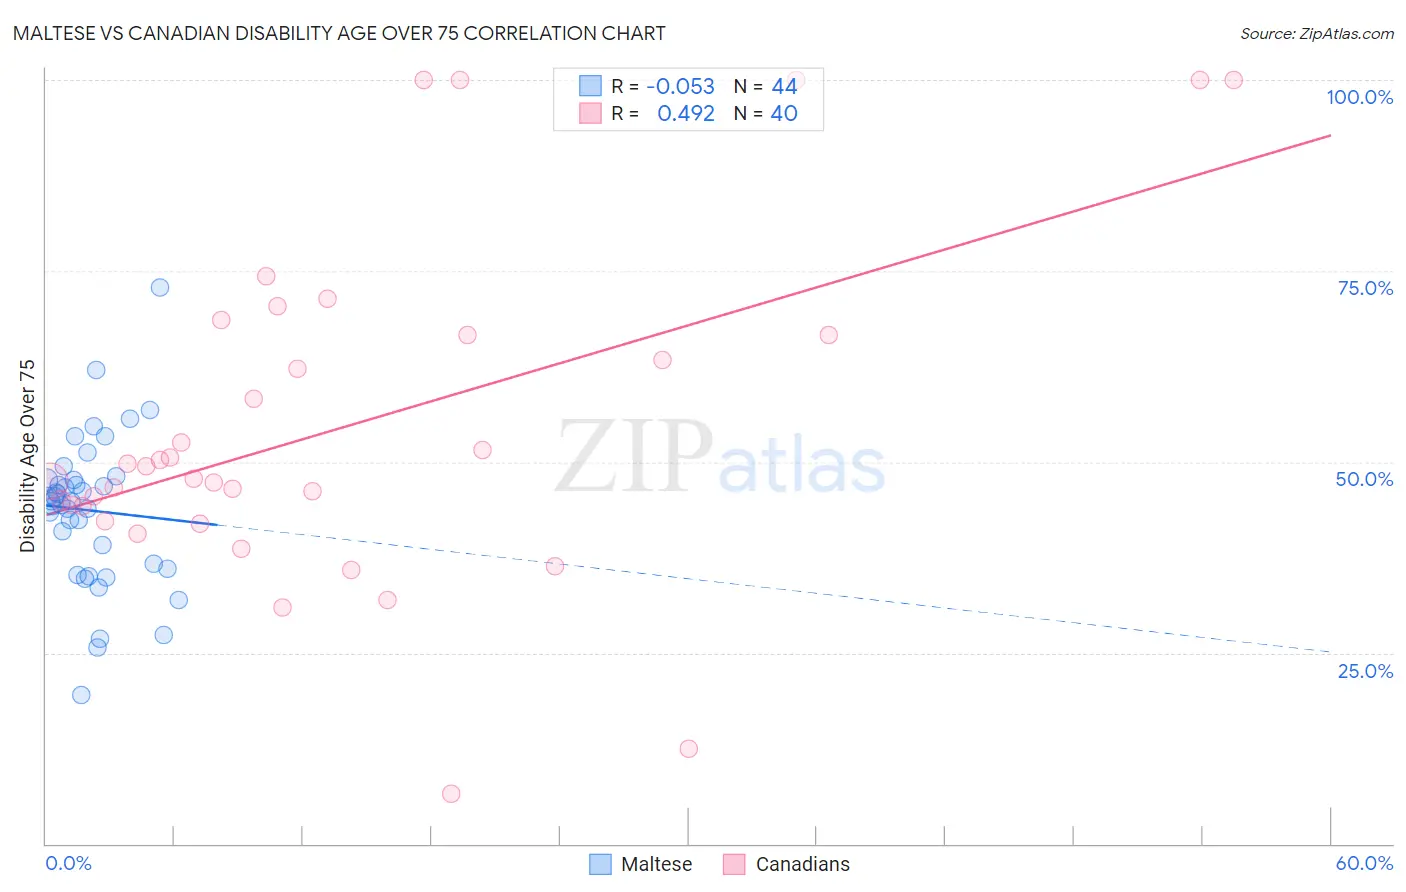
Maltese vs Canadian Disability Age Over 75 Correlation Chart
The statistical analysis conducted on geographies consisting of 126,418,061 people shows a slight negative correlation between the proportion of Maltese and percentage of population with a disability over the age of 75 in the United States with a correlation coefficient (R) of -0.053 and weighted average of 45.8%. Similarly, the statistical analysis conducted on geographies consisting of 436,817,150 people shows a moderate positive correlation between the proportion of Canadians and percentage of population with a disability over the age of 75 in the United States with a correlation coefficient (R) of 0.492 and weighted average of 46.6%, a difference of 1.6%.
Disability Age Over 75 Correlation Summary
| Measurement | Maltese | Canadian |
| Minimum | 19.4% | 6.5% |
| Maximum | 72.8% | 100.0% |
| Range | 53.3% | 93.5% |
| Mean | 43.6% | 54.6% |
| Median | 44.8% | 48.6% |
| Interquartile 25% (IQ1) | 36.4% | 43.2% |
| Interquartile 75% (IQ3) | 47.7% | 66.7% |
| Interquartile Range (IQR) | 11.3% | 23.5% |
| Standard Deviation (Sample) | 9.8% | 22.3% |
| Standard Deviation (Population) | 9.7% | 22.0% |
Similar Demographics by Disability Age Over 75
Demographics Similar to Maltese by Disability Age Over 75
In terms of disability age over 75, the demographic groups most similar to Maltese are Slovak (45.8%, a difference of 0.0%), Immigrants from Netherlands (45.9%, a difference of 0.070%), Immigrants from Italy (45.8%, a difference of 0.080%), Immigrants from Turkey (45.9%, a difference of 0.080%), and Immigrants from Israel (45.9%, a difference of 0.080%).
| Demographics | Rating | Rank | Disability Age Over 75 |
| Croatians | 99.8 /100 | #48 | Exceptional 45.7% |
| Immigrants | North America | 99.8 /100 | #49 | Exceptional 45.7% |
| Belgians | 99.7 /100 | #50 | Exceptional 45.8% |
| Immigrants | Korea | 99.7 /100 | #51 | Exceptional 45.8% |
| Immigrants | France | 99.7 /100 | #52 | Exceptional 45.8% |
| Immigrants | Italy | 99.7 /100 | #53 | Exceptional 45.8% |
| Slovaks | 99.6 /100 | #54 | Exceptional 45.8% |
| Maltese | 99.6 /100 | #55 | Exceptional 45.8% |
| Immigrants | Netherlands | 99.6 /100 | #56 | Exceptional 45.9% |
| Immigrants | Turkey | 99.6 /100 | #57 | Exceptional 45.9% |
| Immigrants | Israel | 99.6 /100 | #58 | Exceptional 45.9% |
| Iranians | 99.6 /100 | #59 | Exceptional 45.9% |
| Immigrants | Europe | 99.6 /100 | #60 | Exceptional 45.9% |
| Immigrants | Argentina | 99.6 /100 | #61 | Exceptional 45.9% |
| Burmese | 99.5 /100 | #62 | Exceptional 45.9% |
Demographics Similar to Canadians by Disability Age Over 75
In terms of disability age over 75, the demographic groups most similar to Canadians are Czechoslovakian (46.6%, a difference of 0.030%), Immigrants from Nepal (46.6%, a difference of 0.030%), Scandinavian (46.6%, a difference of 0.080%), Hungarian (46.5%, a difference of 0.10%), and Immigrants from Albania (46.6%, a difference of 0.12%).
| Demographics | Rating | Rank | Disability Age Over 75 |
| Immigrants | Pakistan | 96.1 /100 | #112 | Exceptional 46.5% |
| Irish | 96.0 /100 | #113 | Exceptional 46.5% |
| Dutch | 95.9 /100 | #114 | Exceptional 46.5% |
| British | 95.7 /100 | #115 | Exceptional 46.5% |
| Indians (Asian) | 95.7 /100 | #116 | Exceptional 46.5% |
| Hungarians | 95.3 /100 | #117 | Exceptional 46.5% |
| Czechoslovakians | 94.7 /100 | #118 | Exceptional 46.6% |
| Canadians | 94.4 /100 | #119 | Exceptional 46.6% |
| Immigrants | Nepal | 94.1 /100 | #120 | Exceptional 46.6% |
| Scandinavians | 93.6 /100 | #121 | Exceptional 46.6% |
| Immigrants | Albania | 93.2 /100 | #122 | Exceptional 46.6% |
| Immigrants | Colombia | 92.6 /100 | #123 | Exceptional 46.7% |
| Immigrants | South America | 91.8 /100 | #124 | Exceptional 46.7% |
| Colombians | 91.3 /100 | #125 | Exceptional 46.7% |
| Europeans | 91.2 /100 | #126 | Exceptional 46.7% |