Maltese vs Immigrants from Eritrea Disability Age Over 75
COMPARE
Maltese
Immigrants from Eritrea
Disability Age Over 75
Disability Age Over 75 Comparison
Maltese
Immigrants from Eritrea
45.8%
DISABILITY AGE OVER 75
99.6/ 100
METRIC RATING
55th/ 347
METRIC RANK
47.7%
DISABILITY AGE OVER 75
22.4/ 100
METRIC RATING
199th/ 347
METRIC RANK
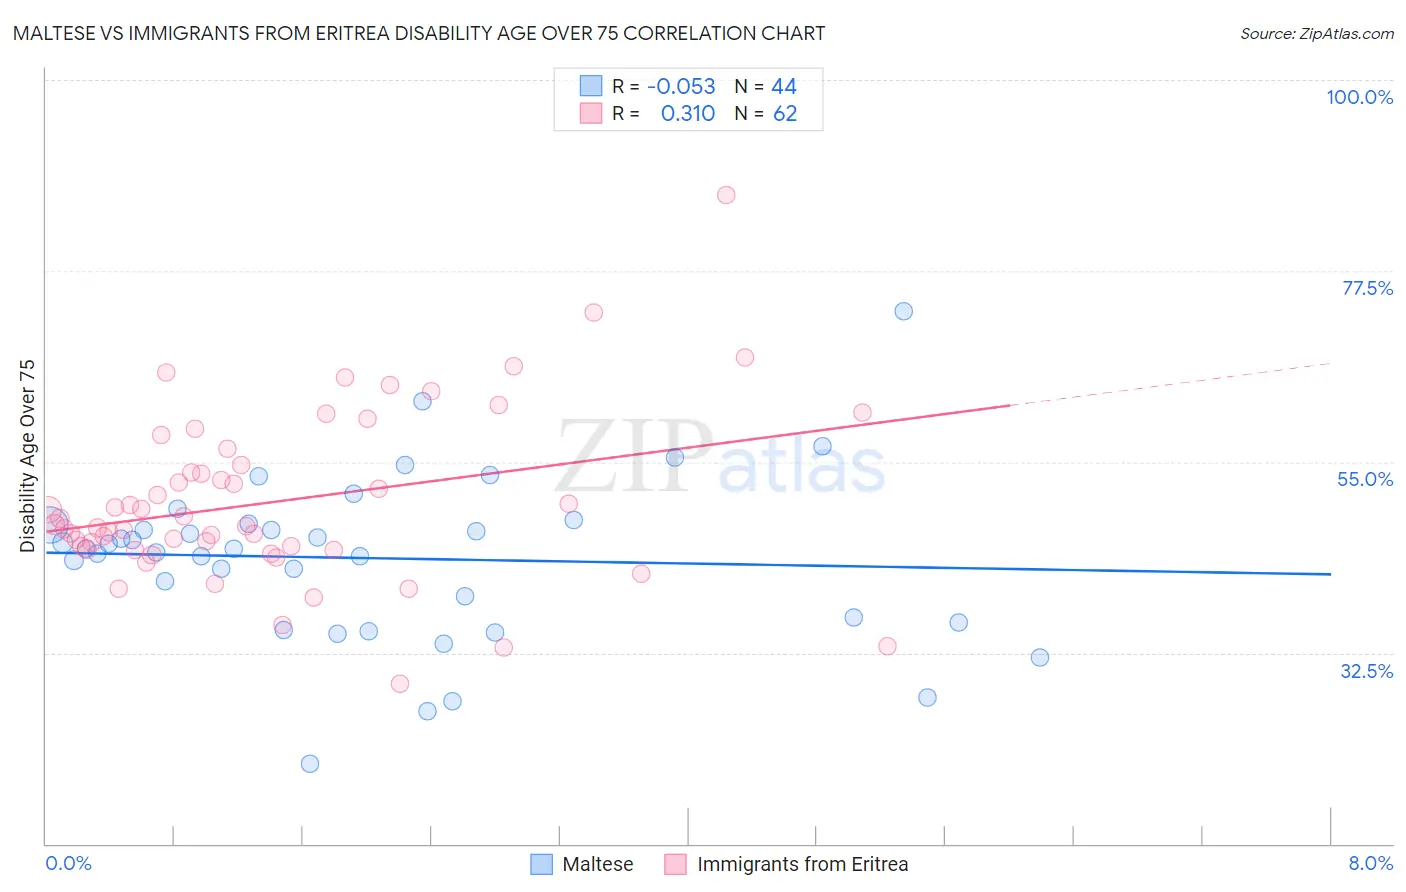
Maltese vs Immigrants from Eritrea Disability Age Over 75 Correlation Chart
The statistical analysis conducted on geographies consisting of 126,418,061 people shows a slight negative correlation between the proportion of Maltese and percentage of population with a disability over the age of 75 in the United States with a correlation coefficient (R) of -0.053 and weighted average of 45.8%. Similarly, the statistical analysis conducted on geographies consisting of 104,842,780 people shows a mild positive correlation between the proportion of Immigrants from Eritrea and percentage of population with a disability over the age of 75 in the United States with a correlation coefficient (R) of 0.310 and weighted average of 47.7%, a difference of 4.0%.
Disability Age Over 75 Correlation Summary
| Measurement | Maltese | Immigrants from Eritrea |
| Minimum | 19.4% | 28.9% |
| Maximum | 72.8% | 86.5% |
| Range | 53.3% | 57.6% |
| Mean | 43.6% | 50.3% |
| Median | 44.8% | 47.5% |
| Interquartile 25% (IQ1) | 36.4% | 44.7% |
| Interquartile 75% (IQ3) | 47.7% | 54.6% |
| Interquartile Range (IQR) | 11.3% | 9.9% |
| Standard Deviation (Sample) | 9.8% | 10.0% |
| Standard Deviation (Population) | 9.7% | 9.9% |
Similar Demographics by Disability Age Over 75
Demographics Similar to Maltese by Disability Age Over 75
In terms of disability age over 75, the demographic groups most similar to Maltese are Slovak (45.8%, a difference of 0.0%), Immigrants from Netherlands (45.9%, a difference of 0.070%), Immigrants from Italy (45.8%, a difference of 0.080%), Immigrants from Turkey (45.9%, a difference of 0.080%), and Immigrants from Israel (45.9%, a difference of 0.080%).
| Demographics | Rating | Rank | Disability Age Over 75 |
| Croatians | 99.8 /100 | #48 | Exceptional 45.7% |
| Immigrants | North America | 99.8 /100 | #49 | Exceptional 45.7% |
| Belgians | 99.7 /100 | #50 | Exceptional 45.8% |
| Immigrants | Korea | 99.7 /100 | #51 | Exceptional 45.8% |
| Immigrants | France | 99.7 /100 | #52 | Exceptional 45.8% |
| Immigrants | Italy | 99.7 /100 | #53 | Exceptional 45.8% |
| Slovaks | 99.6 /100 | #54 | Exceptional 45.8% |
| Maltese | 99.6 /100 | #55 | Exceptional 45.8% |
| Immigrants | Netherlands | 99.6 /100 | #56 | Exceptional 45.9% |
| Immigrants | Turkey | 99.6 /100 | #57 | Exceptional 45.9% |
| Immigrants | Israel | 99.6 /100 | #58 | Exceptional 45.9% |
| Iranians | 99.6 /100 | #59 | Exceptional 45.9% |
| Immigrants | Europe | 99.6 /100 | #60 | Exceptional 45.9% |
| Immigrants | Argentina | 99.6 /100 | #61 | Exceptional 45.9% |
| Burmese | 99.5 /100 | #62 | Exceptional 45.9% |
Demographics Similar to Immigrants from Eritrea by Disability Age Over 75
In terms of disability age over 75, the demographic groups most similar to Immigrants from Eritrea are Immigrants from Ukraine (47.7%, a difference of 0.020%), Pakistani (47.7%, a difference of 0.030%), Immigrants from Somalia (47.7%, a difference of 0.030%), Immigrants from Portugal (47.6%, a difference of 0.040%), and Immigrants from Cuba (47.7%, a difference of 0.050%).
| Demographics | Rating | Rank | Disability Age Over 75 |
| Immigrants | Jamaica | 28.3 /100 | #192 | Fair 47.6% |
| Ottawa | 28.1 /100 | #193 | Fair 47.6% |
| Immigrants | Lebanon | 26.5 /100 | #194 | Fair 47.6% |
| Immigrants | Trinidad and Tobago | 25.3 /100 | #195 | Fair 47.6% |
| Immigrants | Portugal | 23.8 /100 | #196 | Fair 47.6% |
| Pakistanis | 23.4 /100 | #197 | Fair 47.7% |
| Immigrants | Ukraine | 23.2 /100 | #198 | Fair 47.7% |
| Immigrants | Eritrea | 22.4 /100 | #199 | Fair 47.7% |
| Immigrants | Somalia | 21.4 /100 | #200 | Fair 47.7% |
| Immigrants | Cuba | 20.9 /100 | #201 | Fair 47.7% |
| Immigrants | Bahamas | 20.7 /100 | #202 | Fair 47.7% |
| Trinidadians and Tobagonians | 20.0 /100 | #203 | Fair 47.7% |
| Nigerians | 19.2 /100 | #204 | Poor 47.7% |
| Immigrants | Ghana | 19.1 /100 | #205 | Poor 47.7% |
| Jamaicans | 19.0 /100 | #206 | Poor 47.7% |