Immigrants from Vietnam vs Immigrants from Nigeria Cognitive Disability
COMPARE
Immigrants from Vietnam
Immigrants from Nigeria
Cognitive Disability
Cognitive Disability Comparison
Immigrants from Vietnam
Immigrants from Nigeria
17.0%
COGNITIVE DISABILITY
92.4/ 100
METRIC RATING
130th/ 347
METRIC RANK
18.0%
COGNITIVE DISABILITY
0.2/ 100
METRIC RATING
274th/ 347
METRIC RANK
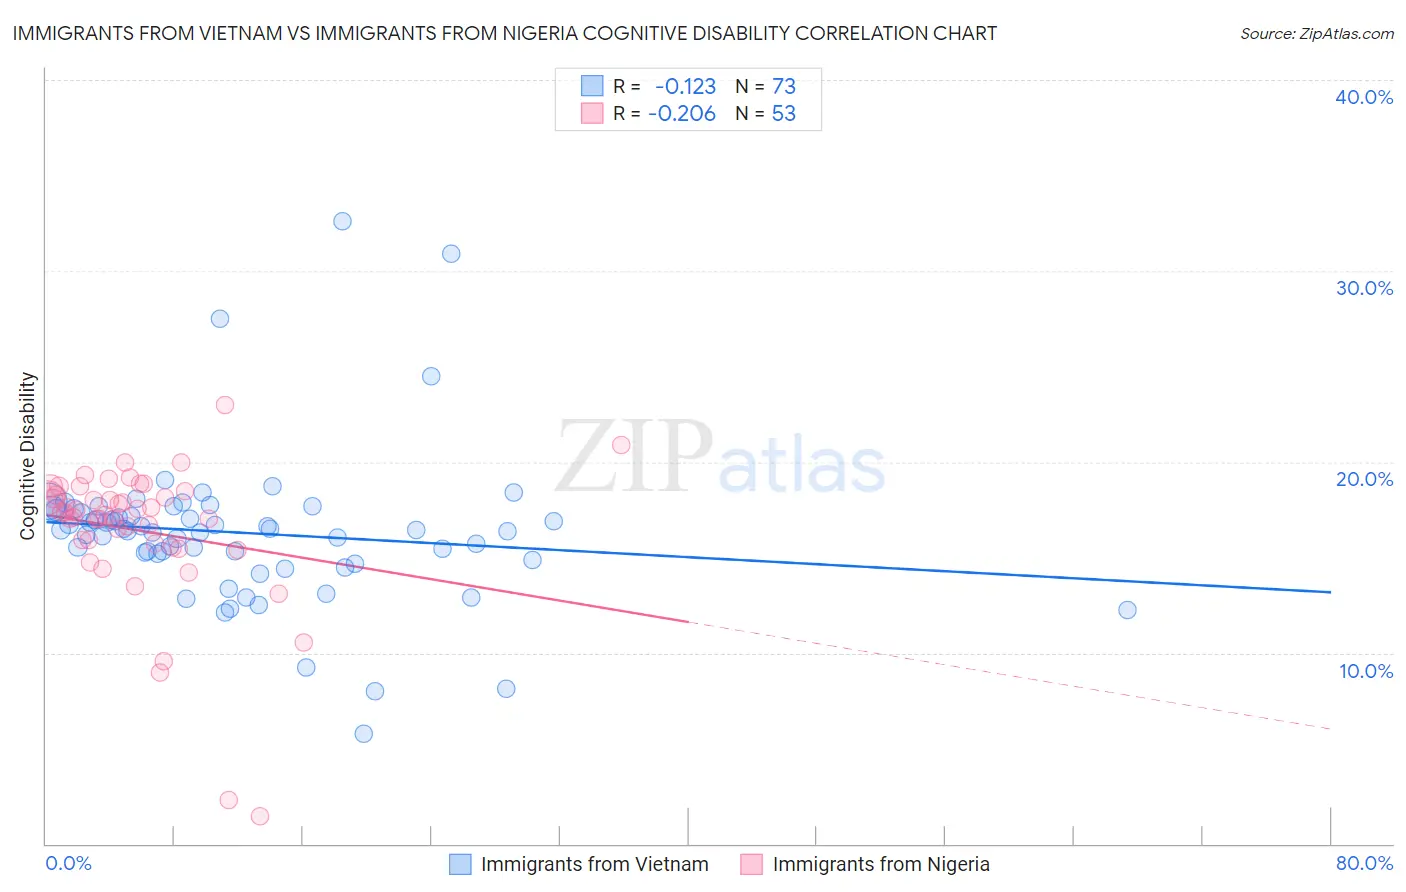
Immigrants from Vietnam vs Immigrants from Nigeria Cognitive Disability Correlation Chart
The statistical analysis conducted on geographies consisting of 404,767,660 people shows a poor negative correlation between the proportion of Immigrants from Vietnam and percentage of population with cognitive disability in the United States with a correlation coefficient (R) of -0.123 and weighted average of 17.0%. Similarly, the statistical analysis conducted on geographies consisting of 283,477,063 people shows a weak negative correlation between the proportion of Immigrants from Nigeria and percentage of population with cognitive disability in the United States with a correlation coefficient (R) of -0.206 and weighted average of 18.0%, a difference of 6.3%.
Cognitive Disability Correlation Summary
| Measurement | Immigrants from Vietnam | Immigrants from Nigeria |
| Minimum | 5.8% | 1.5% |
| Maximum | 32.6% | 23.0% |
| Range | 26.8% | 21.5% |
| Mean | 16.3% | 16.4% |
| Median | 16.4% | 17.3% |
| Interquartile 25% (IQ1) | 15.0% | 15.6% |
| Interquartile 75% (IQ3) | 17.5% | 18.4% |
| Interquartile Range (IQR) | 2.5% | 2.7% |
| Standard Deviation (Sample) | 4.0% | 3.8% |
| Standard Deviation (Population) | 4.0% | 3.8% |
Similar Demographics by Cognitive Disability
Demographics Similar to Immigrants from Vietnam by Cognitive Disability
In terms of cognitive disability, the demographic groups most similar to Immigrants from Vietnam are Immigrants from Germany (17.0%, a difference of 0.020%), White/Caucasian (17.0%, a difference of 0.020%), Immigrants from Jordan (17.0%, a difference of 0.050%), Immigrants from Uruguay (17.0%, a difference of 0.060%), and Nicaraguan (17.0%, a difference of 0.070%).
| Demographics | Rating | Rank | Cognitive Disability |
| Portuguese | 94.7 /100 | #123 | Exceptional 16.9% |
| Turks | 94.5 /100 | #124 | Exceptional 16.9% |
| Scandinavians | 94.1 /100 | #125 | Exceptional 16.9% |
| Europeans | 93.4 /100 | #126 | Exceptional 17.0% |
| Immigrants | Costa Rica | 93.1 /100 | #127 | Exceptional 17.0% |
| Nicaraguans | 93.0 /100 | #128 | Exceptional 17.0% |
| Immigrants | Uruguay | 92.9 /100 | #129 | Exceptional 17.0% |
| Immigrants | Vietnam | 92.4 /100 | #130 | Exceptional 17.0% |
| Immigrants | Germany | 92.1 /100 | #131 | Exceptional 17.0% |
| Whites/Caucasians | 92.1 /100 | #132 | Exceptional 17.0% |
| Immigrants | Jordan | 91.9 /100 | #133 | Exceptional 17.0% |
| Immigrants | Chile | 91.7 /100 | #134 | Exceptional 17.0% |
| Lebanese | 91.3 /100 | #135 | Exceptional 17.0% |
| Israelis | 91.0 /100 | #136 | Exceptional 17.0% |
| Immigrants | Norway | 90.9 /100 | #137 | Exceptional 17.0% |
Demographics Similar to Immigrants from Nigeria by Cognitive Disability
In terms of cognitive disability, the demographic groups most similar to Immigrants from Nigeria are Immigrants from Nepal (18.0%, a difference of 0.010%), Immigrants from Laos (18.1%, a difference of 0.10%), Immigrants from Honduras (18.0%, a difference of 0.13%), Potawatomi (18.0%, a difference of 0.14%), and Yuman (18.1%, a difference of 0.15%).
| Demographics | Rating | Rank | Cognitive Disability |
| Nepalese | 0.3 /100 | #267 | Tragic 18.0% |
| Cherokee | 0.3 /100 | #268 | Tragic 18.0% |
| Hondurans | 0.3 /100 | #269 | Tragic 18.0% |
| Immigrants | Bahamas | 0.3 /100 | #270 | Tragic 18.0% |
| Potawatomi | 0.2 /100 | #271 | Tragic 18.0% |
| Immigrants | Honduras | 0.2 /100 | #272 | Tragic 18.0% |
| Immigrants | Nepal | 0.2 /100 | #273 | Tragic 18.0% |
| Immigrants | Nigeria | 0.2 /100 | #274 | Tragic 18.0% |
| Immigrants | Laos | 0.2 /100 | #275 | Tragic 18.1% |
| Yuman | 0.2 /100 | #276 | Tragic 18.1% |
| Immigrants | Kuwait | 0.2 /100 | #277 | Tragic 18.1% |
| Immigrants | Micronesia | 0.2 /100 | #278 | Tragic 18.1% |
| Chippewa | 0.1 /100 | #279 | Tragic 18.1% |
| West Indians | 0.1 /100 | #280 | Tragic 18.1% |
| Yakama | 0.1 /100 | #281 | Tragic 18.1% |