Malaysian vs Cypriot Disability Age Over 75
COMPARE
Malaysian
Cypriot
Disability Age Over 75
Disability Age Over 75 Comparison
Malaysians
Cypriots
49.0%
DISABILITY AGE OVER 75
0.2/ 100
METRIC RATING
267th/ 347
METRIC RANK
43.5%
DISABILITY AGE OVER 75
100.0/ 100
METRIC RATING
1st/ 347
METRIC RANK
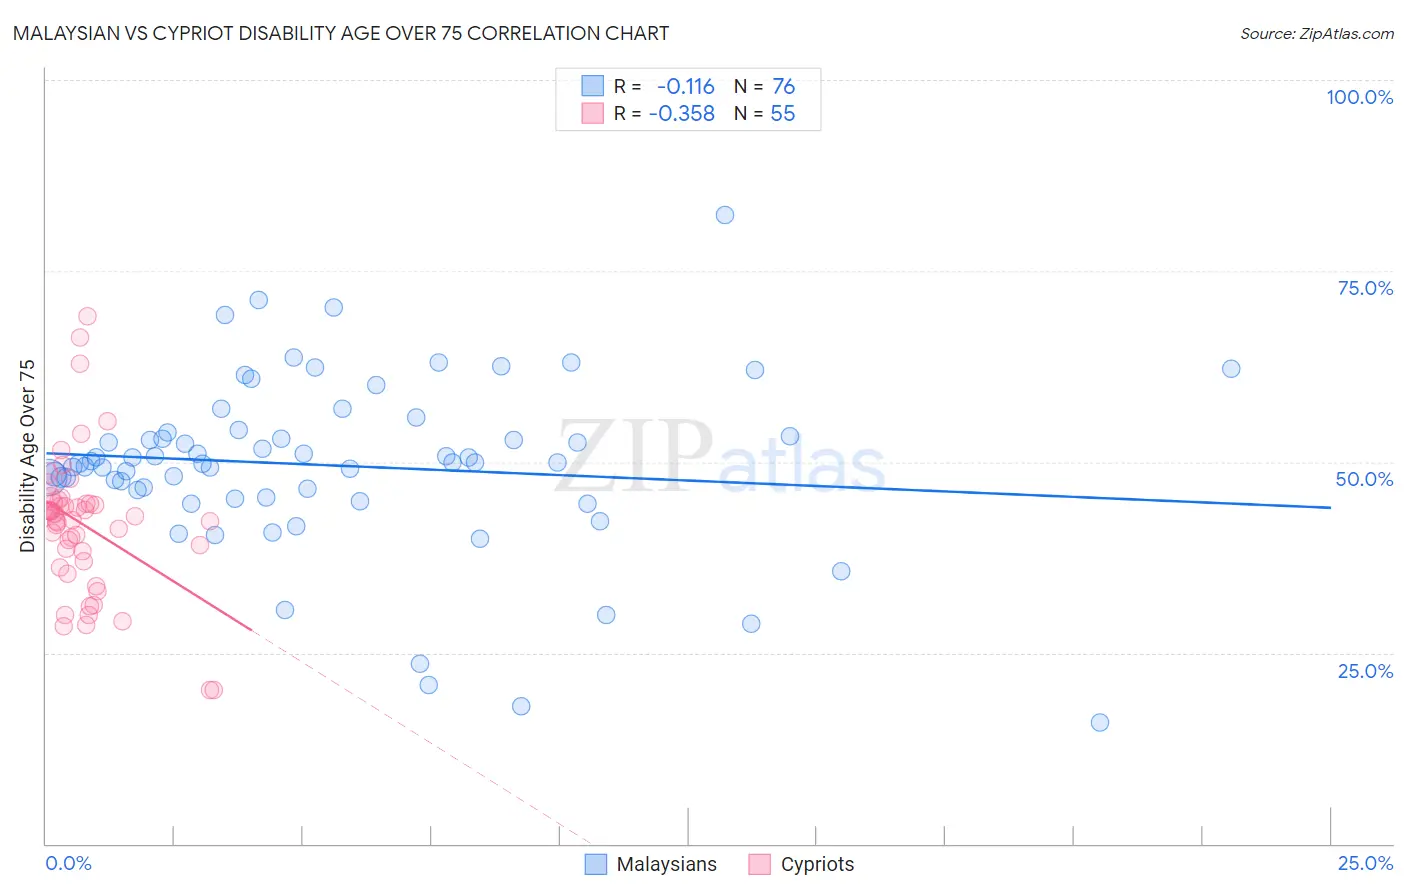
Malaysian vs Cypriot Disability Age Over 75 Correlation Chart
The statistical analysis conducted on geographies consisting of 225,778,475 people shows a poor negative correlation between the proportion of Malaysians and percentage of population with a disability over the age of 75 in the United States with a correlation coefficient (R) of -0.116 and weighted average of 49.0%. Similarly, the statistical analysis conducted on geographies consisting of 61,837,952 people shows a mild negative correlation between the proportion of Cypriots and percentage of population with a disability over the age of 75 in the United States with a correlation coefficient (R) of -0.358 and weighted average of 43.5%, a difference of 12.7%.
Disability Age Over 75 Correlation Summary
| Measurement | Malaysian | Cypriot |
| Minimum | 15.9% | 20.1% |
| Maximum | 82.4% | 69.0% |
| Range | 66.5% | 48.9% |
| Mean | 49.5% | 41.8% |
| Median | 50.0% | 42.9% |
| Interquartile 25% (IQ1) | 45.8% | 37.0% |
| Interquartile 75% (IQ3) | 53.6% | 44.7% |
| Interquartile Range (IQR) | 7.8% | 7.7% |
| Standard Deviation (Sample) | 11.5% | 9.3% |
| Standard Deviation (Population) | 11.4% | 9.3% |
Similar Demographics by Disability Age Over 75
Demographics Similar to Malaysians by Disability Age Over 75
In terms of disability age over 75, the demographic groups most similar to Malaysians are Guatemalan (49.0%, a difference of 0.020%), Immigrants from El Salvador (49.0%, a difference of 0.040%), Potawatomi (49.0%, a difference of 0.060%), Fijian (49.0%, a difference of 0.080%), and Assyrian/Chaldean/Syriac (49.1%, a difference of 0.090%).
| Demographics | Rating | Rank | Disability Age Over 75 |
| Immigrants | Afghanistan | 0.4 /100 | #260 | Tragic 48.8% |
| Africans | 0.3 /100 | #261 | Tragic 48.9% |
| Immigrants | West Indies | 0.3 /100 | #262 | Tragic 48.9% |
| Salvadorans | 0.3 /100 | #263 | Tragic 48.9% |
| Immigrants | Honduras | 0.3 /100 | #264 | Tragic 48.9% |
| Hondurans | 0.3 /100 | #265 | Tragic 48.9% |
| U.S. Virgin Islanders | 0.2 /100 | #266 | Tragic 48.9% |
| Malaysians | 0.2 /100 | #267 | Tragic 49.0% |
| Guatemalans | 0.2 /100 | #268 | Tragic 49.0% |
| Immigrants | El Salvador | 0.2 /100 | #269 | Tragic 49.0% |
| Potawatomi | 0.2 /100 | #270 | Tragic 49.0% |
| Fijians | 0.2 /100 | #271 | Tragic 49.0% |
| Assyrians/Chaldeans/Syriacs | 0.2 /100 | #272 | Tragic 49.1% |
| Immigrants | Iraq | 0.1 /100 | #273 | Tragic 49.1% |
| Immigrants | Guatemala | 0.1 /100 | #274 | Tragic 49.1% |
Demographics Similar to Cypriots by Disability Age Over 75
In terms of disability age over 75, the demographic groups most similar to Cypriots are Immigrants from Ireland (44.7%, a difference of 2.7%), Eastern European (44.8%, a difference of 3.0%), Carpatho Rusyn (44.8%, a difference of 3.0%), Luxembourger (44.8%, a difference of 3.0%), and Immigrants from Lithuania (44.9%, a difference of 3.1%).
| Demographics | Rating | Rank | Disability Age Over 75 |
| Cypriots | 100.0 /100 | #1 | Exceptional 43.5% |
| Immigrants | Ireland | 100.0 /100 | #2 | Exceptional 44.7% |
| Eastern Europeans | 100.0 /100 | #3 | Exceptional 44.8% |
| Carpatho Rusyns | 100.0 /100 | #4 | Exceptional 44.8% |
| Luxembourgers | 100.0 /100 | #5 | Exceptional 44.8% |
| Immigrants | Lithuania | 100.0 /100 | #6 | Exceptional 44.9% |
| Okinawans | 100.0 /100 | #7 | Exceptional 44.9% |
| Immigrants | Austria | 100.0 /100 | #8 | Exceptional 44.9% |
| Paraguayans | 100.0 /100 | #9 | Exceptional 45.0% |
| Bulgarians | 100.0 /100 | #10 | Exceptional 45.1% |
| Lithuanians | 100.0 /100 | #11 | Exceptional 45.1% |
| Immigrants | Czechoslovakia | 100.0 /100 | #12 | Exceptional 45.1% |
| Latvians | 100.0 /100 | #13 | Exceptional 45.1% |
| Immigrants | Scotland | 100.0 /100 | #14 | Exceptional 45.1% |
| Immigrants | Sweden | 100.0 /100 | #15 | Exceptional 45.1% |