Malaysian vs British Child Poverty Among Boys Under 16
COMPARE
Malaysian
British
Child Poverty Among Boys Under 16
Child Poverty Among Boys Under 16 Comparison
Malaysians
British
17.6%
CHILD POVERTY AMONG BOYS UNDER 16
7.6/ 100
METRIC RATING
208th/ 347
METRIC RANK
15.0%
CHILD POVERTY AMONG BOYS UNDER 16
96.2/ 100
METRIC RATING
98th/ 347
METRIC RANK
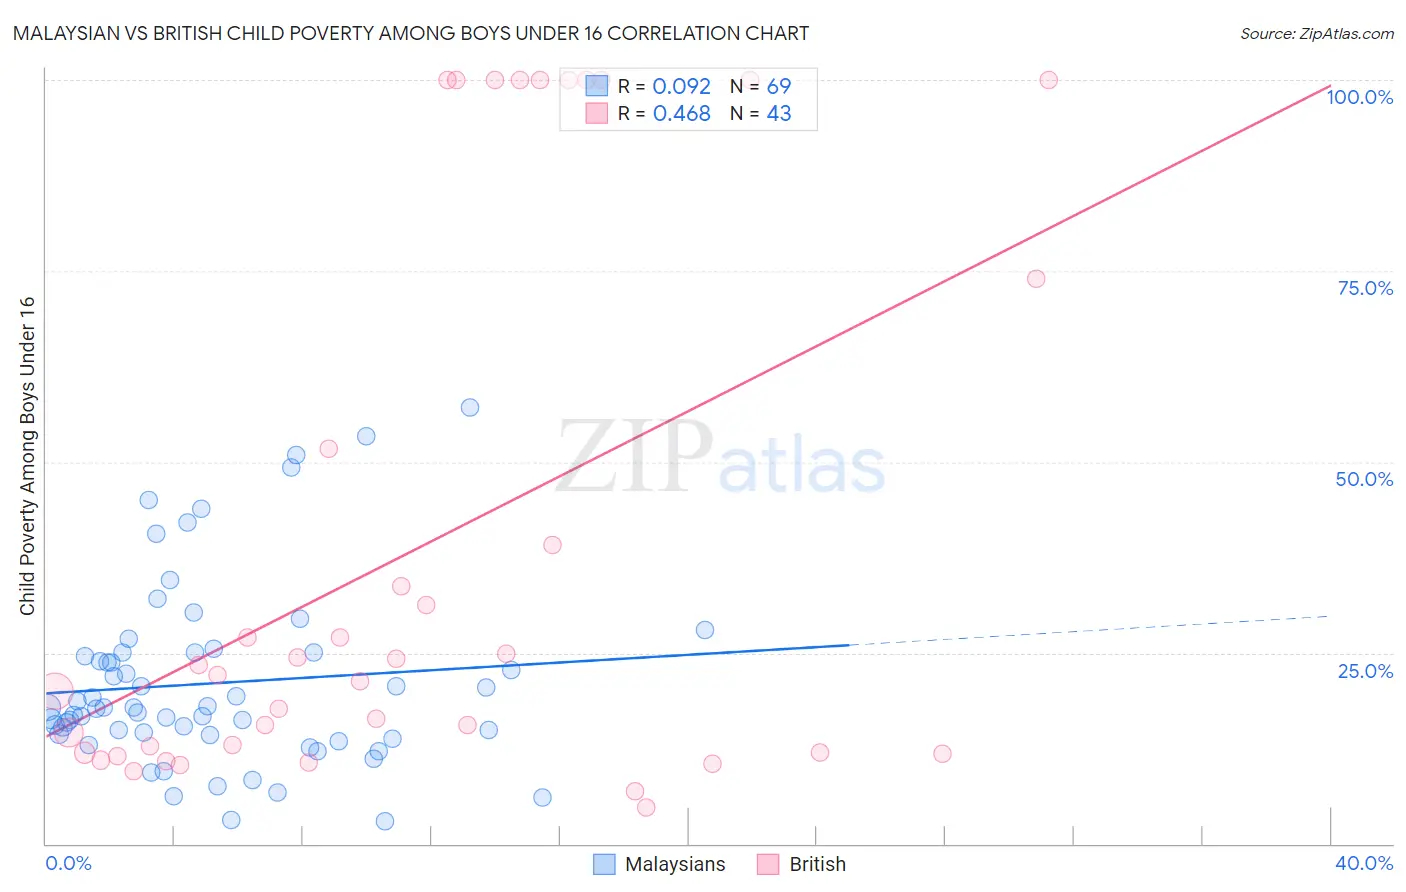
Malaysian vs British Child Poverty Among Boys Under 16 Correlation Chart
The statistical analysis conducted on geographies consisting of 224,540,798 people shows a slight positive correlation between the proportion of Malaysians and poverty level among boys under the age of 16 in the United States with a correlation coefficient (R) of 0.092 and weighted average of 17.6%. Similarly, the statistical analysis conducted on geographies consisting of 515,985,739 people shows a moderate positive correlation between the proportion of British and poverty level among boys under the age of 16 in the United States with a correlation coefficient (R) of 0.468 and weighted average of 15.0%, a difference of 17.6%.
Child Poverty Among Boys Under 16 Correlation Summary
| Measurement | Malaysian | British |
| Minimum | 2.9% | 4.7% |
| Maximum | 57.1% | 100.0% |
| Range | 54.2% | 95.3% |
| Mean | 21.0% | 38.9% |
| Median | 17.8% | 22.1% |
| Interquartile 25% (IQ1) | 14.3% | 11.9% |
| Interquartile 75% (IQ3) | 25.0% | 73.9% |
| Interquartile Range (IQR) | 10.8% | 62.0% |
| Standard Deviation (Sample) | 11.9% | 36.2% |
| Standard Deviation (Population) | 11.8% | 35.7% |
Similar Demographics by Child Poverty Among Boys Under 16
Demographics Similar to Malaysians by Child Poverty Among Boys Under 16
In terms of child poverty among boys under 16, the demographic groups most similar to Malaysians are Alaskan Athabascan (17.6%, a difference of 0.11%), Immigrants from Thailand (17.5%, a difference of 0.22%), Immigrants from Armenia (17.6%, a difference of 0.28%), Immigrants (17.6%, a difference of 0.35%), and Aleut (17.7%, a difference of 0.39%).
| Demographics | Rating | Rank | Child Poverty Among Boys Under 16 |
| Immigrants | Afghanistan | 13.7 /100 | #201 | Poor 17.3% |
| Immigrants | Sierra Leone | 13.4 /100 | #202 | Poor 17.3% |
| Immigrants | Uzbekistan | 13.3 /100 | #203 | Poor 17.3% |
| Ugandans | 12.5 /100 | #204 | Poor 17.3% |
| Immigrants | Portugal | 11.2 /100 | #205 | Poor 17.4% |
| German Russians | 10.9 /100 | #206 | Poor 17.4% |
| Immigrants | Thailand | 8.2 /100 | #207 | Tragic 17.5% |
| Malaysians | 7.6 /100 | #208 | Tragic 17.6% |
| Alaskan Athabascans | 7.3 /100 | #209 | Tragic 17.6% |
| Immigrants | Armenia | 6.8 /100 | #210 | Tragic 17.6% |
| Immigrants | Immigrants | 6.7 /100 | #211 | Tragic 17.6% |
| Aleuts | 6.6 /100 | #212 | Tragic 17.7% |
| Immigrants | Eastern Africa | 6.0 /100 | #213 | Tragic 17.7% |
| Panamanians | 5.9 /100 | #214 | Tragic 17.7% |
| Osage | 5.8 /100 | #215 | Tragic 17.7% |
Demographics Similar to British by Child Poverty Among Boys Under 16
In terms of child poverty among boys under 16, the demographic groups most similar to British are Immigrants from Egypt (14.9%, a difference of 0.040%), Immigrants from North Macedonia (14.9%, a difference of 0.050%), Immigrants from France (15.0%, a difference of 0.090%), Finnish (14.9%, a difference of 0.31%), and Chilean (15.0%, a difference of 0.33%).
| Demographics | Rating | Rank | Child Poverty Among Boys Under 16 |
| Paraguayans | 96.8 /100 | #91 | Exceptional 14.9% |
| Argentineans | 96.7 /100 | #92 | Exceptional 14.9% |
| Sri Lankans | 96.7 /100 | #93 | Exceptional 14.9% |
| Immigrants | Italy | 96.7 /100 | #94 | Exceptional 14.9% |
| Finns | 96.5 /100 | #95 | Exceptional 14.9% |
| Immigrants | North Macedonia | 96.3 /100 | #96 | Exceptional 14.9% |
| Immigrants | Egypt | 96.2 /100 | #97 | Exceptional 14.9% |
| British | 96.2 /100 | #98 | Exceptional 15.0% |
| Immigrants | France | 96.1 /100 | #99 | Exceptional 15.0% |
| Chileans | 95.8 /100 | #100 | Exceptional 15.0% |
| Immigrants | Belarus | 95.7 /100 | #101 | Exceptional 15.0% |
| Romanians | 95.6 /100 | #102 | Exceptional 15.0% |
| Immigrants | Denmark | 95.6 /100 | #103 | Exceptional 15.0% |
| Immigrants | Switzerland | 95.4 /100 | #104 | Exceptional 15.0% |
| Dutch | 95.4 /100 | #105 | Exceptional 15.0% |