Lumbee vs Immigrants from Nicaragua Unemployment Among Ages 65 to 74 years
COMPARE
Lumbee
Immigrants from Nicaragua
Unemployment Among Ages 65 to 74 years
Unemployment Among Ages 65 to 74 years Comparison
Lumbee
Immigrants from Nicaragua
4.8%
UNEMPLOYMENT AMONG AGES 65 TO 74 YEARS
100.0/ 100
METRIC RATING
13th/ 347
METRIC RANK
5.1%
UNEMPLOYMENT AMONG AGES 65 TO 74 YEARS
99.6/ 100
METRIC RATING
54th/ 347
METRIC RANK
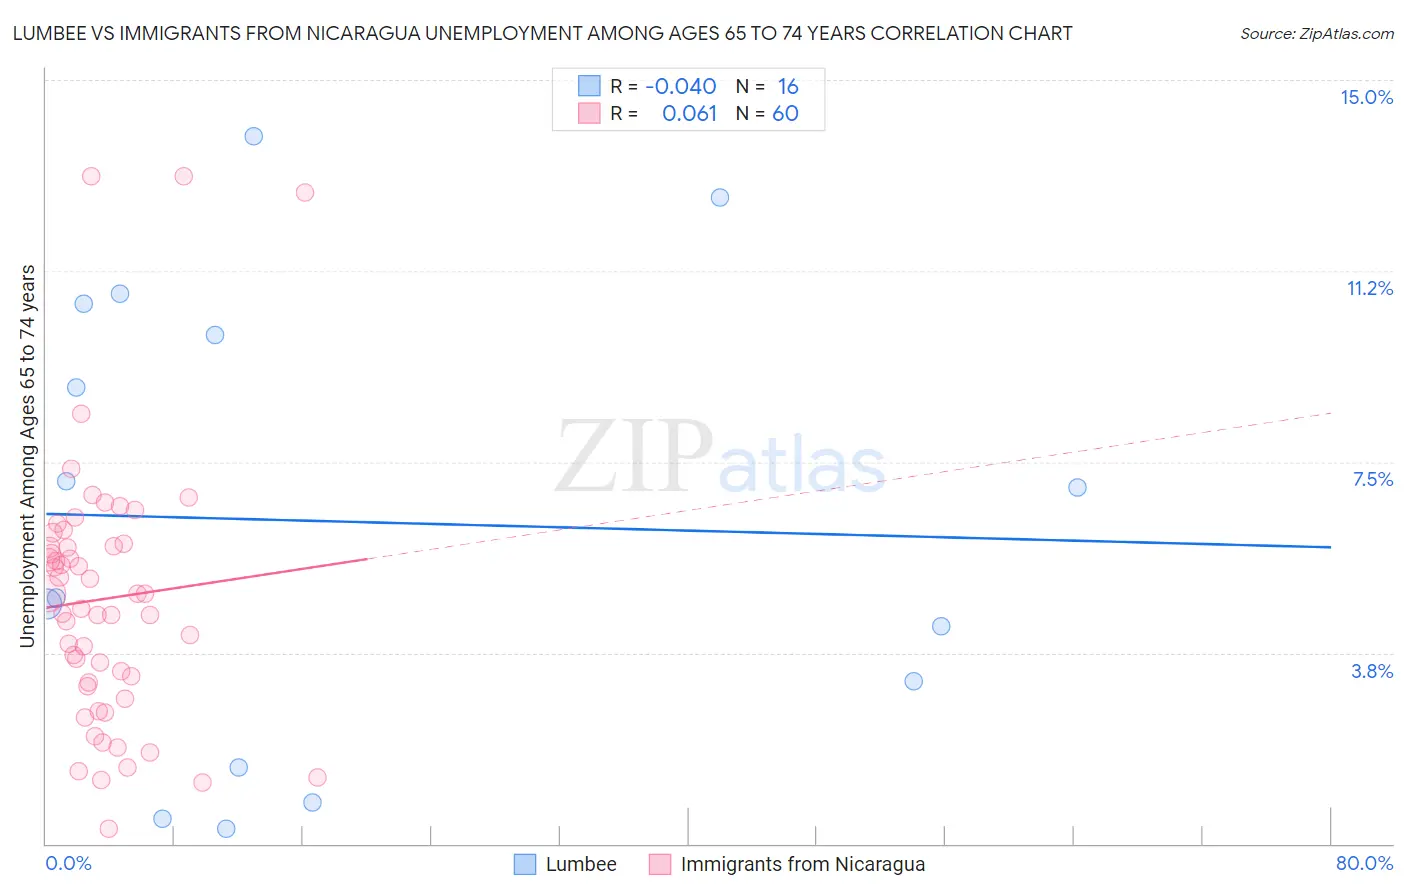
Lumbee vs Immigrants from Nicaragua Unemployment Among Ages 65 to 74 years Correlation Chart
The statistical analysis conducted on geographies consisting of 85,752,030 people shows no correlation between the proportion of Lumbee and unemployment rate among population between the ages 65 and 74 in the United States with a correlation coefficient (R) of -0.040 and weighted average of 4.8%. Similarly, the statistical analysis conducted on geographies consisting of 220,810,717 people shows a slight positive correlation between the proportion of Immigrants from Nicaragua and unemployment rate among population between the ages 65 and 74 in the United States with a correlation coefficient (R) of 0.061 and weighted average of 5.1%, a difference of 7.7%.
Unemployment Among Ages 65 to 74 years Correlation Summary
| Measurement | Lumbee | Immigrants from Nicaragua |
| Minimum | 0.30% | 0.30% |
| Maximum | 13.9% | 13.1% |
| Range | 13.6% | 12.8% |
| Mean | 6.3% | 4.8% |
| Median | 5.9% | 4.8% |
| Interquartile 25% (IQ1) | 2.4% | 3.1% |
| Interquartile 75% (IQ3) | 10.3% | 5.9% |
| Interquartile Range (IQR) | 7.9% | 2.7% |
| Standard Deviation (Sample) | 4.5% | 2.6% |
| Standard Deviation (Population) | 4.3% | 2.6% |
Similar Demographics by Unemployment Among Ages 65 to 74 years
Demographics Similar to Lumbee by Unemployment Among Ages 65 to 74 years
In terms of unemployment among ages 65 to 74 years, the demographic groups most similar to Lumbee are Tongan (4.7%, a difference of 0.18%), Cuban (4.8%, a difference of 0.28%), Immigrants from Congo (4.7%, a difference of 0.34%), Osage (4.7%, a difference of 0.75%), and Chickasaw (4.7%, a difference of 0.87%).
| Demographics | Rating | Rank | Unemployment Among Ages 65 to 74 years |
| Immigrants | Cuba | 100.0 /100 | #6 | Exceptional 4.6% |
| Indonesians | 100.0 /100 | #7 | Exceptional 4.7% |
| Comanche | 100.0 /100 | #8 | Exceptional 4.7% |
| Chickasaw | 100.0 /100 | #9 | Exceptional 4.7% |
| Osage | 100.0 /100 | #10 | Exceptional 4.7% |
| Immigrants | Congo | 100.0 /100 | #11 | Exceptional 4.7% |
| Tongans | 100.0 /100 | #12 | Exceptional 4.7% |
| Lumbee | 100.0 /100 | #13 | Exceptional 4.8% |
| Cubans | 100.0 /100 | #14 | Exceptional 4.8% |
| Immigrants | North Macedonia | 100.0 /100 | #15 | Exceptional 4.8% |
| Immigrants | Burma/Myanmar | 100.0 /100 | #16 | Exceptional 4.8% |
| Kenyans | 100.0 /100 | #17 | Exceptional 4.8% |
| Creek | 100.0 /100 | #18 | Exceptional 4.8% |
| Menominee | 100.0 /100 | #19 | Exceptional 4.8% |
| Immigrants | Zaire | 100.0 /100 | #20 | Exceptional 4.8% |
Demographics Similar to Immigrants from Nicaragua by Unemployment Among Ages 65 to 74 years
In terms of unemployment among ages 65 to 74 years, the demographic groups most similar to Immigrants from Nicaragua are European (5.1%, a difference of 0.030%), Immigrants from Ethiopia (5.1%, a difference of 0.030%), Carpatho Rusyn (5.1%, a difference of 0.090%), Swedish (5.1%, a difference of 0.16%), and Croatian (5.1%, a difference of 0.17%).
| Demographics | Rating | Rank | Unemployment Among Ages 65 to 74 years |
| Immigrants | Uganda | 99.8 /100 | #47 | Exceptional 5.1% |
| Choctaw | 99.8 /100 | #48 | Exceptional 5.1% |
| Immigrants | Austria | 99.8 /100 | #49 | Exceptional 5.1% |
| Immigrants | Zimbabwe | 99.7 /100 | #50 | Exceptional 5.1% |
| Immigrants | Kazakhstan | 99.7 /100 | #51 | Exceptional 5.1% |
| Europeans | 99.6 /100 | #52 | Exceptional 5.1% |
| Immigrants | Ethiopia | 99.6 /100 | #53 | Exceptional 5.1% |
| Immigrants | Nicaragua | 99.6 /100 | #54 | Exceptional 5.1% |
| Carpatho Rusyns | 99.6 /100 | #55 | Exceptional 5.1% |
| Swedes | 99.5 /100 | #56 | Exceptional 5.1% |
| Croatians | 99.5 /100 | #57 | Exceptional 5.1% |
| Germans | 99.5 /100 | #58 | Exceptional 5.1% |
| Immigrants | Bulgaria | 99.4 /100 | #59 | Exceptional 5.1% |
| Immigrants | Jordan | 99.4 /100 | #60 | Exceptional 5.1% |
| Immigrants | Taiwan | 99.4 /100 | #61 | Exceptional 5.1% |