Immigrants from Latvia vs Immigrants from South Eastern Asia Cognitive Disability
COMPARE
Immigrants from Latvia
Immigrants from South Eastern Asia
Cognitive Disability
Cognitive Disability Comparison
Immigrants from Latvia
Immigrants from South Eastern Asia
17.2%
COGNITIVE DISABILITY
73.2/ 100
METRIC RATING
159th/ 347
METRIC RANK
17.0%
COGNITIVE DISABILITY
88.7/ 100
METRIC RATING
145th/ 347
METRIC RANK
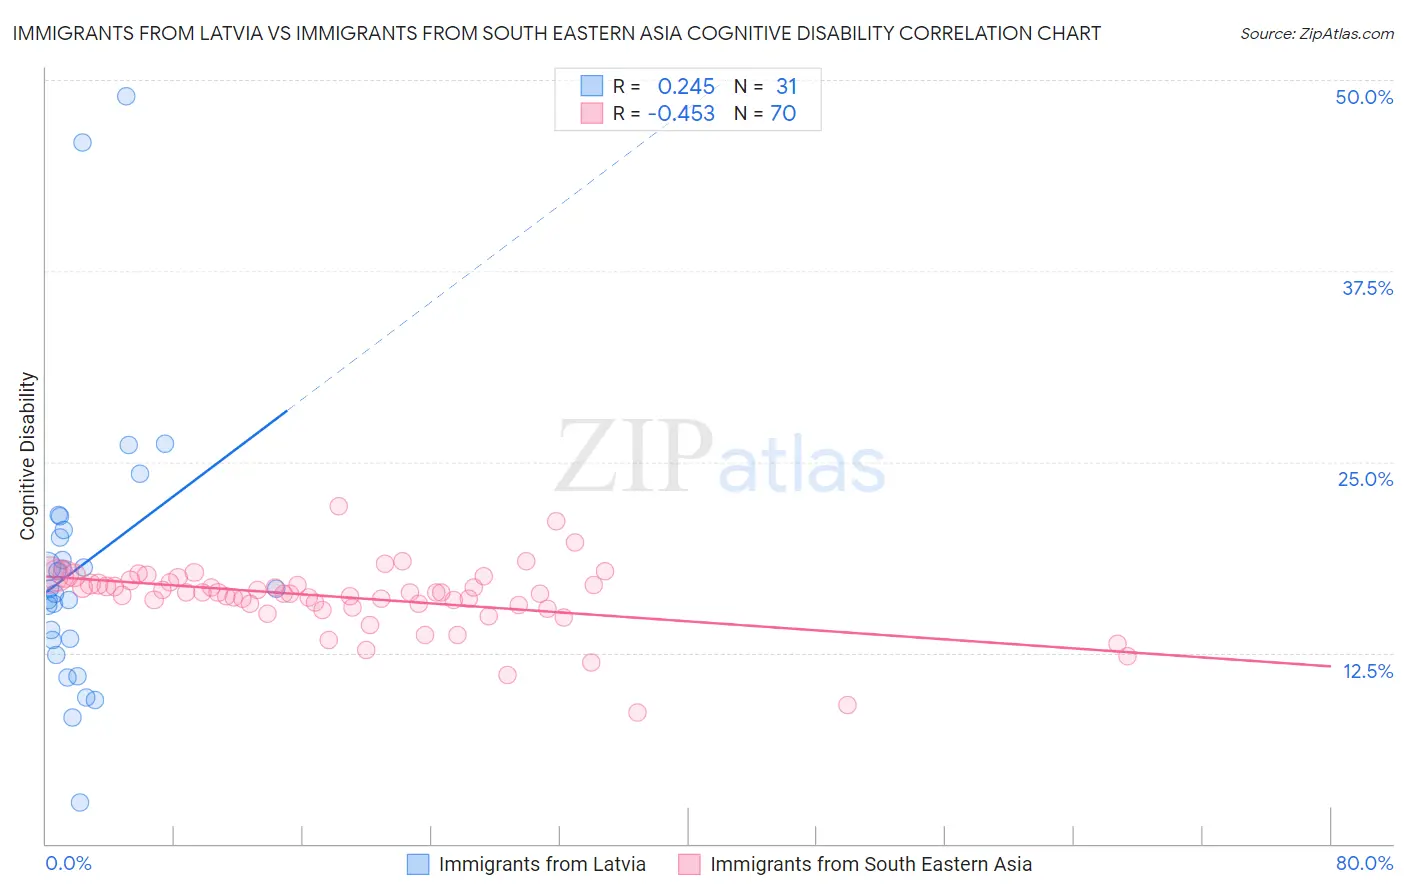
Immigrants from Latvia vs Immigrants from South Eastern Asia Cognitive Disability Correlation Chart
The statistical analysis conducted on geographies consisting of 113,738,689 people shows a weak positive correlation between the proportion of Immigrants from Latvia and percentage of population with cognitive disability in the United States with a correlation coefficient (R) of 0.245 and weighted average of 17.2%. Similarly, the statistical analysis conducted on geographies consisting of 512,576,863 people shows a moderate negative correlation between the proportion of Immigrants from South Eastern Asia and percentage of population with cognitive disability in the United States with a correlation coefficient (R) of -0.453 and weighted average of 17.0%, a difference of 0.76%.
Cognitive Disability Correlation Summary
| Measurement | Immigrants from Latvia | Immigrants from South Eastern Asia |
| Minimum | 2.7% | 8.6% |
| Maximum | 49.0% | 22.1% |
| Range | 46.2% | 13.5% |
| Mean | 18.2% | 16.1% |
| Median | 16.7% | 16.4% |
| Interquartile 25% (IQ1) | 13.4% | 15.6% |
| Interquartile 75% (IQ3) | 20.5% | 17.1% |
| Interquartile Range (IQR) | 7.2% | 1.5% |
| Standard Deviation (Sample) | 9.4% | 2.2% |
| Standard Deviation (Population) | 9.2% | 2.2% |
Demographics Similar to Immigrants from Latvia and Immigrants from South Eastern Asia by Cognitive Disability
In terms of cognitive disability, the demographic groups most similar to Immigrants from Latvia are Celtic (17.1%, a difference of 0.030%), Australian (17.2%, a difference of 0.030%), American (17.2%, a difference of 0.040%), Yugoslavian (17.2%, a difference of 0.060%), and Immigrants from Australia (17.1%, a difference of 0.11%). Similarly, the demographic groups most similar to Immigrants from South Eastern Asia are British (17.0%, a difference of 0.050%), Immigrants from Brazil (17.0%, a difference of 0.050%), Costa Rican (17.0%, a difference of 0.050%), Carpatho Rusyn (17.0%, a difference of 0.070%), and Scotch-Irish (17.1%, a difference of 0.18%).
| Demographics | Rating | Rank | Cognitive Disability |
| Carpatho Rusyns | 89.6 /100 | #142 | Excellent 17.0% |
| British | 89.3 /100 | #143 | Excellent 17.0% |
| Immigrants | Brazil | 89.3 /100 | #144 | Excellent 17.0% |
| Immigrants | South Eastern Asia | 88.7 /100 | #145 | Excellent 17.0% |
| Costa Ricans | 88.0 /100 | #146 | Excellent 17.0% |
| Scotch-Irish | 85.9 /100 | #147 | Excellent 17.1% |
| French Canadians | 85.7 /100 | #148 | Excellent 17.1% |
| Cypriots | 85.7 /100 | #149 | Excellent 17.1% |
| Basques | 85.5 /100 | #150 | Excellent 17.1% |
| Syrians | 83.0 /100 | #151 | Excellent 17.1% |
| Immigrants | Indonesia | 82.7 /100 | #152 | Excellent 17.1% |
| Immigrants | Kazakhstan | 80.5 /100 | #153 | Excellent 17.1% |
| Immigrants | Malaysia | 79.3 /100 | #154 | Good 17.1% |
| Brazilians | 78.9 /100 | #155 | Good 17.1% |
| Sri Lankans | 78.9 /100 | #156 | Good 17.1% |
| Immigrants | Australia | 76.0 /100 | #157 | Good 17.1% |
| Celtics | 74.1 /100 | #158 | Good 17.1% |
| Immigrants | Latvia | 73.2 /100 | #159 | Good 17.2% |
| Australians | 72.4 /100 | #160 | Good 17.2% |
| Americans | 72.2 /100 | #161 | Good 17.2% |
| Yugoslavians | 71.6 /100 | #162 | Good 17.2% |