Korean vs Immigrants from Yemen Self-Care Disability
COMPARE
Korean
Immigrants from Yemen
Self-Care Disability
Self-Care Disability Comparison
Koreans
Immigrants from Yemen
2.5%
SELF-CARE DISABILITY
15.5/ 100
METRIC RATING
196th/ 347
METRIC RANK
3.0%
SELF-CARE DISABILITY
0.0/ 100
METRIC RATING
336th/ 347
METRIC RANK
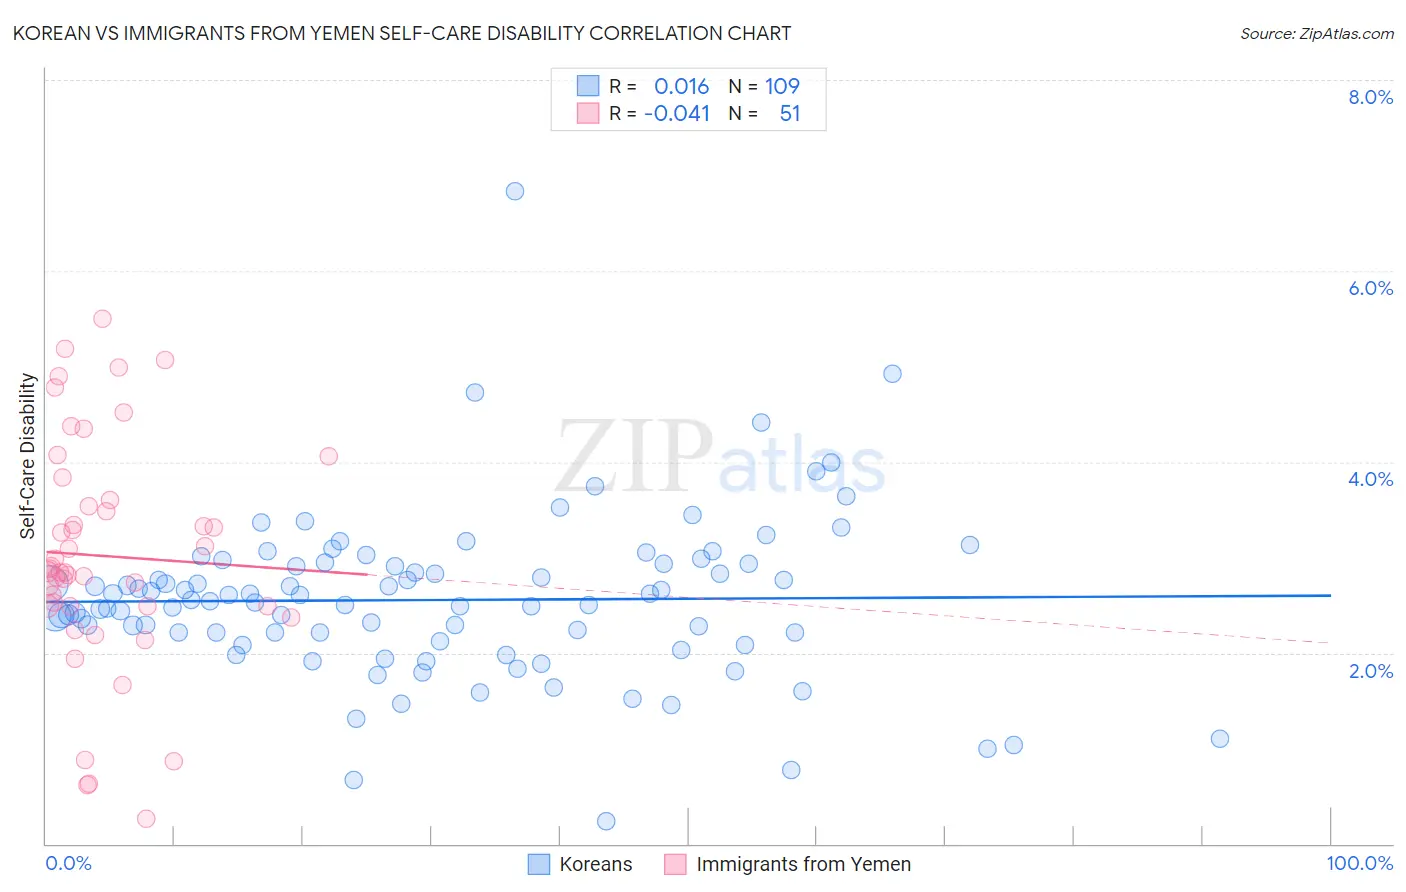
Korean vs Immigrants from Yemen Self-Care Disability Correlation Chart
The statistical analysis conducted on geographies consisting of 509,747,952 people shows no correlation between the proportion of Koreans and percentage of population with self-care disability in the United States with a correlation coefficient (R) of 0.016 and weighted average of 2.5%. Similarly, the statistical analysis conducted on geographies consisting of 82,420,060 people shows no correlation between the proportion of Immigrants from Yemen and percentage of population with self-care disability in the United States with a correlation coefficient (R) of -0.041 and weighted average of 3.0%, a difference of 18.9%.
Self-Care Disability Correlation Summary
| Measurement | Korean | Immigrants from Yemen |
| Minimum | 0.24% | 0.26% |
| Maximum | 6.8% | 5.5% |
| Range | 6.6% | 5.2% |
| Mean | 2.6% | 3.0% |
| Median | 2.5% | 2.8% |
| Interquartile 25% (IQ1) | 2.2% | 2.5% |
| Interquartile 75% (IQ3) | 2.9% | 3.6% |
| Interquartile Range (IQR) | 0.77% | 1.1% |
| Standard Deviation (Sample) | 0.86% | 1.2% |
| Standard Deviation (Population) | 0.86% | 1.2% |
Similar Demographics by Self-Care Disability
Demographics Similar to Koreans by Self-Care Disability
In terms of self-care disability, the demographic groups most similar to Koreans are Immigrants from Southern Europe (2.5%, a difference of 0.010%), Crow (2.5%, a difference of 0.030%), Immigrants (2.5%, a difference of 0.050%), Immigrants from Ghana (2.5%, a difference of 0.070%), and Immigrants from Germany (2.5%, a difference of 0.20%).
| Demographics | Rating | Rank | Self-Care Disability |
| Immigrants | Eastern Europe | 28.0 /100 | #189 | Fair 2.5% |
| Sioux | 24.6 /100 | #190 | Fair 2.5% |
| Moroccans | 22.9 /100 | #191 | Fair 2.5% |
| Soviet Union | 22.2 /100 | #192 | Fair 2.5% |
| Ukrainians | 21.4 /100 | #193 | Fair 2.5% |
| Immigrants | Germany | 17.9 /100 | #194 | Poor 2.5% |
| Immigrants | Southern Europe | 15.6 /100 | #195 | Poor 2.5% |
| Koreans | 15.5 /100 | #196 | Poor 2.5% |
| Crow | 15.2 /100 | #197 | Poor 2.5% |
| Immigrants | Immigrants | 15.0 /100 | #198 | Poor 2.5% |
| Immigrants | Ghana | 14.7 /100 | #199 | Poor 2.5% |
| Immigrants | Western Africa | 13.3 /100 | #200 | Poor 2.5% |
| Immigrants | South Eastern Asia | 12.9 /100 | #201 | Poor 2.5% |
| Slovaks | 12.6 /100 | #202 | Poor 2.5% |
| Immigrants | Lebanon | 12.4 /100 | #203 | Poor 2.5% |
Demographics Similar to Immigrants from Yemen by Self-Care Disability
In terms of self-care disability, the demographic groups most similar to Immigrants from Yemen are Immigrants from the Azores (3.0%, a difference of 0.16%), Houma (3.0%, a difference of 0.21%), Dutch West Indian (3.0%, a difference of 0.28%), Kiowa (3.0%, a difference of 0.51%), and Lumbee (3.0%, a difference of 0.87%).
| Demographics | Rating | Rank | Self-Care Disability |
| Cajuns | 0.0 /100 | #329 | Tragic 2.9% |
| Nepalese | 0.0 /100 | #330 | Tragic 3.0% |
| Lumbee | 0.0 /100 | #331 | Tragic 3.0% |
| Kiowa | 0.0 /100 | #332 | Tragic 3.0% |
| Dutch West Indians | 0.0 /100 | #333 | Tragic 3.0% |
| Houma | 0.0 /100 | #334 | Tragic 3.0% |
| Immigrants | Azores | 0.0 /100 | #335 | Tragic 3.0% |
| Immigrants | Yemen | 0.0 /100 | #336 | Tragic 3.0% |
| Choctaw | 0.0 /100 | #337 | Tragic 3.0% |
| Cape Verdeans | 0.0 /100 | #338 | Tragic 3.0% |
| Immigrants | Dominican Republic | 0.0 /100 | #339 | Tragic 3.0% |
| Immigrants | Cabo Verde | 0.0 /100 | #340 | Tragic 3.1% |
| Dominicans | 0.0 /100 | #341 | Tragic 3.1% |
| Colville | 0.0 /100 | #342 | Tragic 3.1% |
| Tohono O'odham | 0.0 /100 | #343 | Tragic 3.1% |