Immigrants from Nigeria vs Immigrants from Yemen Self-Care Disability
COMPARE
Immigrants from Nigeria
Immigrants from Yemen
Self-Care Disability
Self-Care Disability Comparison
Immigrants from Nigeria
Immigrants from Yemen
2.4%
SELF-CARE DISABILITY
90.3/ 100
METRIC RATING
123rd/ 347
METRIC RANK
3.0%
SELF-CARE DISABILITY
0.0/ 100
METRIC RATING
336th/ 347
METRIC RANK
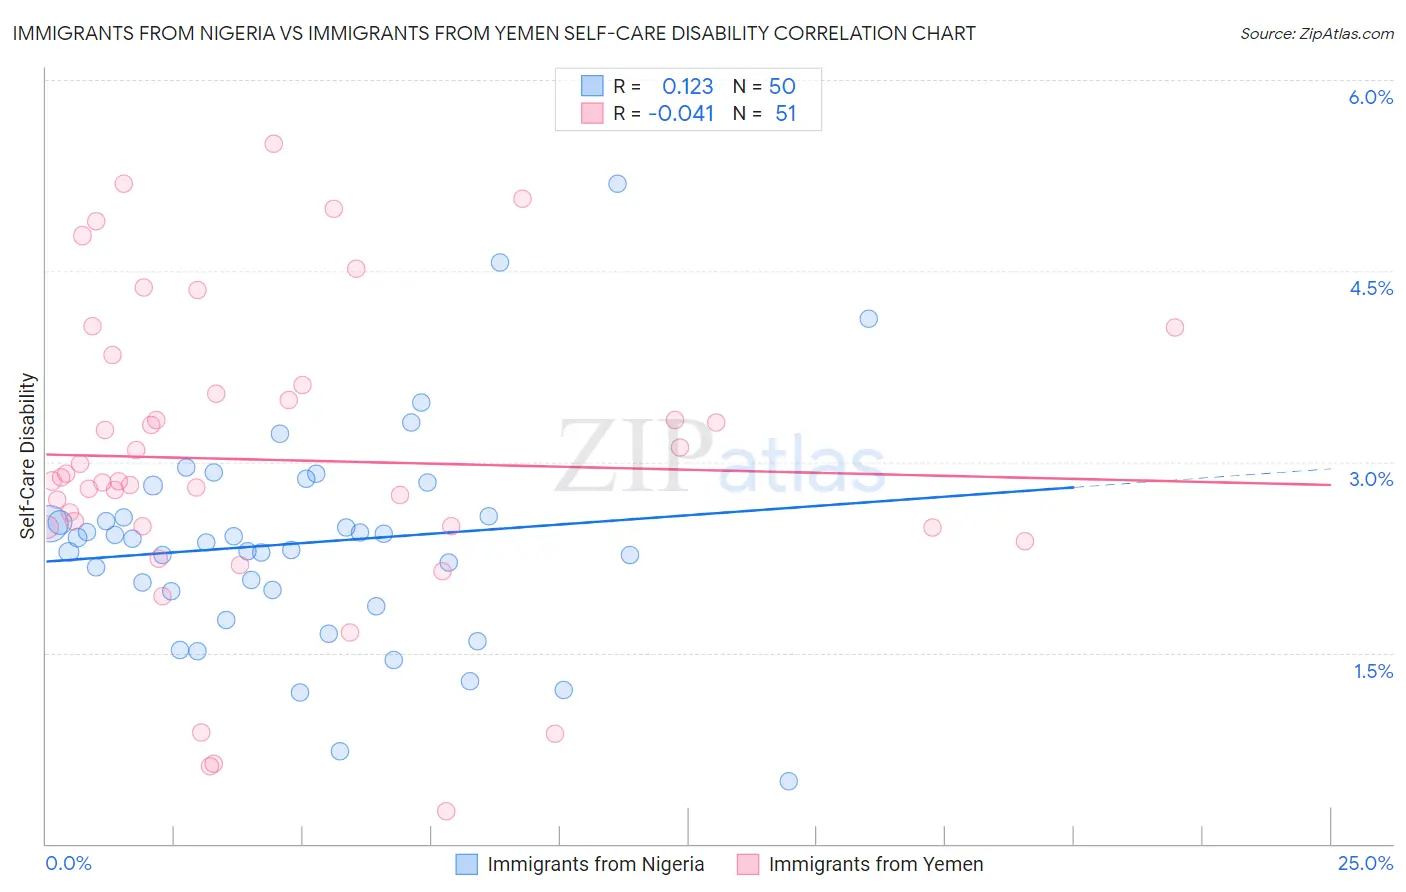
Immigrants from Nigeria vs Immigrants from Yemen Self-Care Disability Correlation Chart
The statistical analysis conducted on geographies consisting of 283,219,403 people shows a poor positive correlation between the proportion of Immigrants from Nigeria and percentage of population with self-care disability in the United States with a correlation coefficient (R) of 0.123 and weighted average of 2.4%. Similarly, the statistical analysis conducted on geographies consisting of 82,420,060 people shows no correlation between the proportion of Immigrants from Yemen and percentage of population with self-care disability in the United States with a correlation coefficient (R) of -0.041 and weighted average of 3.0%, a difference of 24.6%.
Self-Care Disability Correlation Summary
| Measurement | Immigrants from Nigeria | Immigrants from Yemen |
| Minimum | 0.50% | 0.26% |
| Maximum | 5.2% | 5.5% |
| Range | 4.7% | 5.2% |
| Mean | 2.4% | 3.0% |
| Median | 2.4% | 2.8% |
| Interquartile 25% (IQ1) | 2.0% | 2.5% |
| Interquartile 75% (IQ3) | 2.6% | 3.6% |
| Interquartile Range (IQR) | 0.59% | 1.1% |
| Standard Deviation (Sample) | 0.85% | 1.2% |
| Standard Deviation (Population) | 0.84% | 1.2% |
Similar Demographics by Self-Care Disability
Demographics Similar to Immigrants from Nigeria by Self-Care Disability
In terms of self-care disability, the demographic groups most similar to Immigrants from Nigeria are Immigrants from Morocco (2.4%, a difference of 0.010%), Immigrants from North America (2.4%, a difference of 0.010%), Hmong (2.4%, a difference of 0.050%), Belgian (2.4%, a difference of 0.080%), and Colombian (2.4%, a difference of 0.080%).
| Demographics | Rating | Rank | Self-Care Disability |
| Northern Europeans | 92.9 /100 | #116 | Exceptional 2.4% |
| Taiwanese | 92.5 /100 | #117 | Exceptional 2.4% |
| Immigrants | Canada | 92.0 /100 | #118 | Exceptional 2.4% |
| Immigrants | Sierra Leone | 91.8 /100 | #119 | Exceptional 2.4% |
| Uruguayans | 91.5 /100 | #120 | Exceptional 2.4% |
| Peruvians | 91.3 /100 | #121 | Exceptional 2.4% |
| Belgians | 90.9 /100 | #122 | Exceptional 2.4% |
| Immigrants | Nigeria | 90.3 /100 | #123 | Exceptional 2.4% |
| Immigrants | Morocco | 90.2 /100 | #124 | Exceptional 2.4% |
| Immigrants | North America | 90.2 /100 | #124 | Exceptional 2.4% |
| Hmong | 89.9 /100 | #126 | Excellent 2.4% |
| Colombians | 89.7 /100 | #127 | Excellent 2.4% |
| Immigrants | Hungary | 89.6 /100 | #128 | Excellent 2.4% |
| Immigrants | Romania | 89.3 /100 | #129 | Excellent 2.4% |
| Immigrants | Austria | 89.0 /100 | #130 | Excellent 2.4% |
Demographics Similar to Immigrants from Yemen by Self-Care Disability
In terms of self-care disability, the demographic groups most similar to Immigrants from Yemen are Immigrants from the Azores (3.0%, a difference of 0.16%), Houma (3.0%, a difference of 0.21%), Dutch West Indian (3.0%, a difference of 0.28%), Kiowa (3.0%, a difference of 0.51%), and Lumbee (3.0%, a difference of 0.87%).
| Demographics | Rating | Rank | Self-Care Disability |
| Cajuns | 0.0 /100 | #329 | Tragic 2.9% |
| Nepalese | 0.0 /100 | #330 | Tragic 3.0% |
| Lumbee | 0.0 /100 | #331 | Tragic 3.0% |
| Kiowa | 0.0 /100 | #332 | Tragic 3.0% |
| Dutch West Indians | 0.0 /100 | #333 | Tragic 3.0% |
| Houma | 0.0 /100 | #334 | Tragic 3.0% |
| Immigrants | Azores | 0.0 /100 | #335 | Tragic 3.0% |
| Immigrants | Yemen | 0.0 /100 | #336 | Tragic 3.0% |
| Choctaw | 0.0 /100 | #337 | Tragic 3.0% |
| Cape Verdeans | 0.0 /100 | #338 | Tragic 3.0% |
| Immigrants | Dominican Republic | 0.0 /100 | #339 | Tragic 3.0% |
| Immigrants | Cabo Verde | 0.0 /100 | #340 | Tragic 3.1% |
| Dominicans | 0.0 /100 | #341 | Tragic 3.1% |
| Colville | 0.0 /100 | #342 | Tragic 3.1% |
| Tohono O'odham | 0.0 /100 | #343 | Tragic 3.1% |