Korean vs Assyrian/Chaldean/Syriac Male Disability
COMPARE
Korean
Assyrian/Chaldean/Syriac
Male Disability
Male Disability Comparison
Koreans
Assyrians/Chaldeans/Syriacs
11.0%
MALE DISABILITY
77.5/ 100
METRIC RATING
146th/ 347
METRIC RANK
11.4%
MALE DISABILITY
23.2/ 100
METRIC RATING
192nd/ 347
METRIC RANK
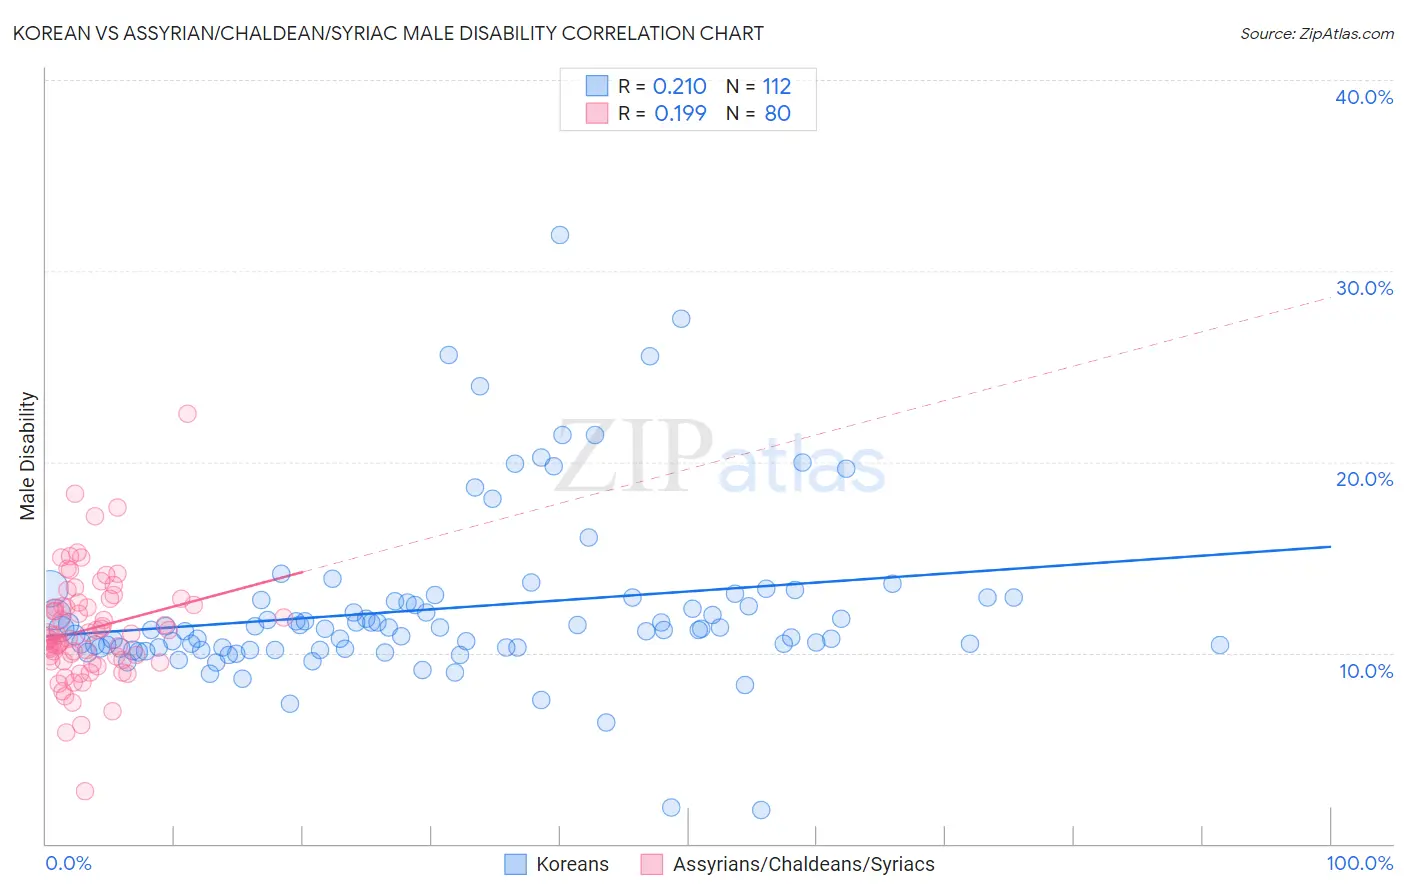
Korean vs Assyrian/Chaldean/Syriac Male Disability Correlation Chart
The statistical analysis conducted on geographies consisting of 510,777,181 people shows a weak positive correlation between the proportion of Koreans and percentage of males with a disability in the United States with a correlation coefficient (R) of 0.210 and weighted average of 11.0%. Similarly, the statistical analysis conducted on geographies consisting of 110,312,508 people shows a poor positive correlation between the proportion of Assyrians/Chaldeans/Syriacs and percentage of males with a disability in the United States with a correlation coefficient (R) of 0.199 and weighted average of 11.4%, a difference of 3.4%.
Male Disability Correlation Summary
| Measurement | Korean | Assyrian/Chaldean/Syriac |
| Minimum | 1.8% | 2.8% |
| Maximum | 31.9% | 22.5% |
| Range | 30.1% | 19.7% |
| Mean | 12.3% | 11.3% |
| Median | 11.3% | 10.9% |
| Interquartile 25% (IQ1) | 10.3% | 9.6% |
| Interquartile 75% (IQ3) | 12.8% | 12.6% |
| Interquartile Range (IQR) | 2.5% | 3.0% |
| Standard Deviation (Sample) | 4.5% | 2.9% |
| Standard Deviation (Population) | 4.5% | 2.9% |
Similar Demographics by Male Disability
Demographics Similar to Koreans by Male Disability
In terms of male disability, the demographic groups most similar to Koreans are Immigrants from Croatia (11.0%, a difference of 0.020%), Sudanese (11.0%, a difference of 0.030%), Costa Rican (11.0%, a difference of 0.040%), Kenyan (11.0%, a difference of 0.050%), and Immigrants from Denmark (11.0%, a difference of 0.090%).
| Demographics | Rating | Rank | Male Disability |
| South Africans | 81.7 /100 | #139 | Excellent 11.0% |
| Immigrants | Italy | 81.5 /100 | #140 | Excellent 11.0% |
| Arabs | 81.5 /100 | #141 | Excellent 11.0% |
| Immigrants | Sudan | 81.5 /100 | #142 | Excellent 11.0% |
| Moroccans | 80.7 /100 | #143 | Excellent 11.0% |
| Kenyans | 78.1 /100 | #144 | Good 11.0% |
| Costa Ricans | 78.0 /100 | #145 | Good 11.0% |
| Koreans | 77.5 /100 | #146 | Good 11.0% |
| Immigrants | Croatia | 77.3 /100 | #147 | Good 11.0% |
| Sudanese | 77.1 /100 | #148 | Good 11.0% |
| Immigrants | Denmark | 76.4 /100 | #149 | Good 11.0% |
| Immigrants | Guatemala | 75.1 /100 | #150 | Good 11.0% |
| Cubans | 74.9 /100 | #151 | Good 11.0% |
| Immigrants | Albania | 74.4 /100 | #152 | Good 11.0% |
| Immigrants | Northern Europe | 73.2 /100 | #153 | Good 11.1% |
Demographics Similar to Assyrians/Chaldeans/Syriacs by Male Disability
In terms of male disability, the demographic groups most similar to Assyrians/Chaldeans/Syriacs are Senegalese (11.4%, a difference of 0.0%), Greek (11.4%, a difference of 0.070%), Belizean (11.4%, a difference of 0.15%), Immigrants from Bosnia and Herzegovina (11.4%, a difference of 0.16%), and Immigrants from Oceania (11.4%, a difference of 0.18%).
| Demographics | Rating | Rank | Male Disability |
| Pakistanis | 30.3 /100 | #185 | Fair 11.3% |
| Immigrants | Zaire | 27.6 /100 | #186 | Fair 11.4% |
| Immigrants | Austria | 27.3 /100 | #187 | Fair 11.4% |
| Estonians | 26.8 /100 | #188 | Fair 11.4% |
| Immigrants | Netherlands | 25.9 /100 | #189 | Fair 11.4% |
| Immigrants | Bosnia and Herzegovina | 25.4 /100 | #190 | Fair 11.4% |
| Senegalese | 23.2 /100 | #191 | Fair 11.4% |
| Assyrians/Chaldeans/Syriacs | 23.2 /100 | #192 | Fair 11.4% |
| Greeks | 22.2 /100 | #193 | Fair 11.4% |
| Belizeans | 21.2 /100 | #194 | Fair 11.4% |
| Immigrants | Oceania | 20.9 /100 | #195 | Fair 11.4% |
| West Indians | 18.4 /100 | #196 | Poor 11.4% |
| Somalis | 18.2 /100 | #197 | Poor 11.4% |
| Immigrants | Jamaica | 16.3 /100 | #198 | Poor 11.5% |
| Lebanese | 15.4 /100 | #199 | Poor 11.5% |