Cree vs Czech Female Disability
COMPARE
Cree
Czech
Female Disability
Female Disability Comparison
Cree
Czechs
13.7%
FEMALE DISABILITY
0.0/ 100
METRIC RATING
308th/ 347
METRIC RANK
12.1%
FEMALE DISABILITY
63.6/ 100
METRIC RATING
164th/ 347
METRIC RANK
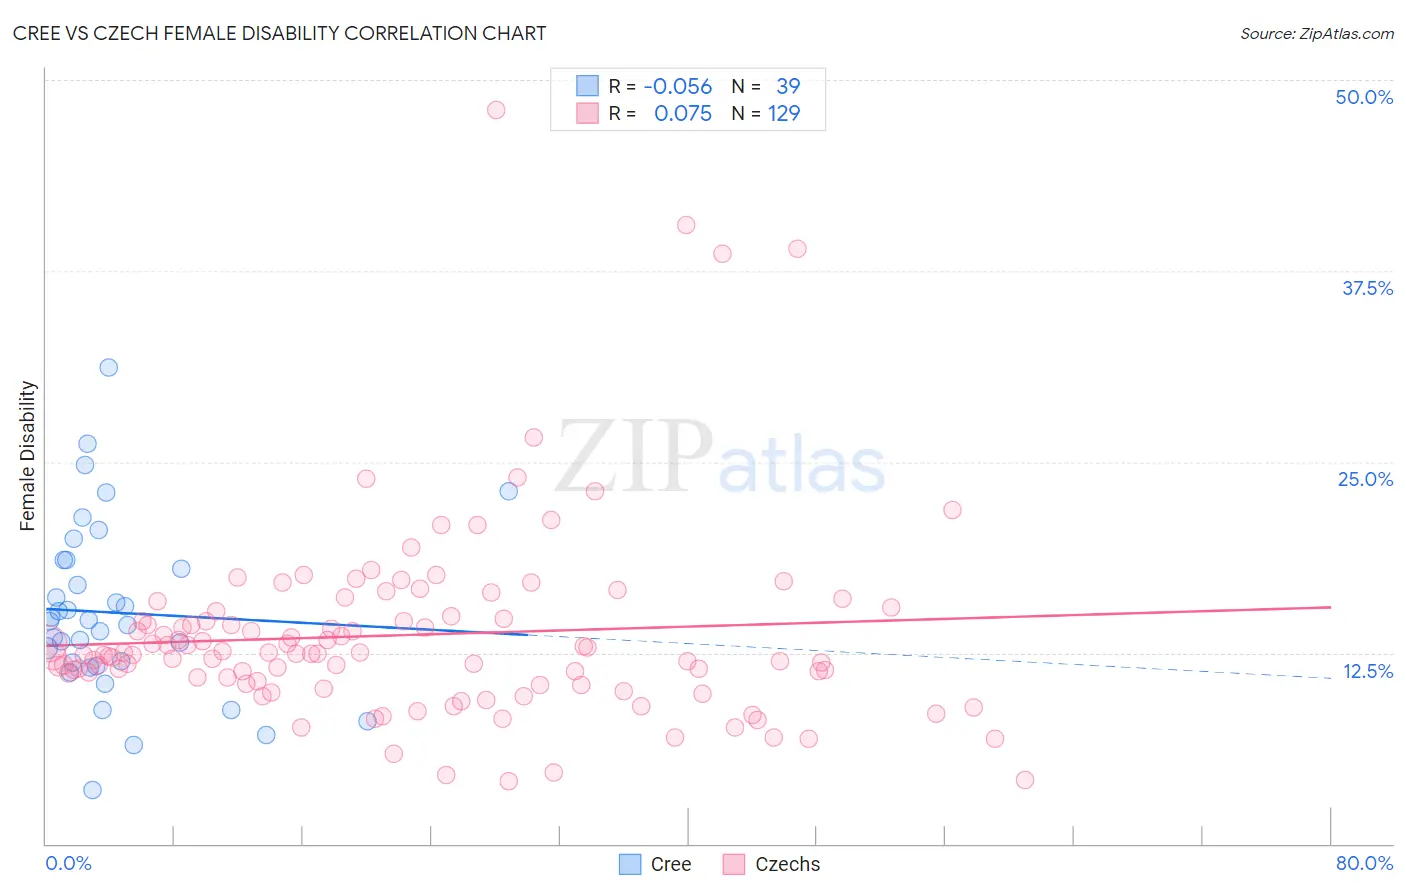
Cree vs Czech Female Disability Correlation Chart
The statistical analysis conducted on geographies consisting of 76,204,869 people shows a slight negative correlation between the proportion of Cree and percentage of females with a disability in the United States with a correlation coefficient (R) of -0.056 and weighted average of 13.7%. Similarly, the statistical analysis conducted on geographies consisting of 484,697,758 people shows a slight positive correlation between the proportion of Czechs and percentage of females with a disability in the United States with a correlation coefficient (R) of 0.075 and weighted average of 12.1%, a difference of 12.8%.
Female Disability Correlation Summary
| Measurement | Cree | Czech |
| Minimum | 3.6% | 4.1% |
| Maximum | 31.2% | 48.0% |
| Range | 27.6% | 43.9% |
| Mean | 15.1% | 13.7% |
| Median | 14.6% | 12.5% |
| Interquartile 25% (IQ1) | 11.6% | 10.6% |
| Interquartile 75% (IQ3) | 18.6% | 14.8% |
| Interquartile Range (IQR) | 7.0% | 4.3% |
| Standard Deviation (Sample) | 5.7% | 6.4% |
| Standard Deviation (Population) | 5.6% | 6.4% |
Similar Demographics by Female Disability
Demographics Similar to Cree by Female Disability
In terms of female disability, the demographic groups most similar to Cree are French American Indian (13.7%, a difference of 0.060%), Apache (13.7%, a difference of 0.18%), Central American Indian (13.6%, a difference of 0.46%), Hopi (13.7%, a difference of 0.46%), and French Canadian (13.6%, a difference of 0.75%).
| Demographics | Rating | Rank | Female Disability |
| Africans | 0.0 /100 | #301 | Tragic 13.4% |
| Scotch-Irish | 0.0 /100 | #302 | Tragic 13.4% |
| Immigrants | Portugal | 0.0 /100 | #303 | Tragic 13.5% |
| Immigrants | Micronesia | 0.0 /100 | #304 | Tragic 13.5% |
| Dominicans | 0.0 /100 | #305 | Tragic 13.5% |
| French Canadians | 0.0 /100 | #306 | Tragic 13.6% |
| Central American Indians | 0.0 /100 | #307 | Tragic 13.6% |
| Cree | 0.0 /100 | #308 | Tragic 13.7% |
| French American Indians | 0.0 /100 | #309 | Tragic 13.7% |
| Apache | 0.0 /100 | #310 | Tragic 13.7% |
| Hopi | 0.0 /100 | #311 | Tragic 13.7% |
| Delaware | 0.0 /100 | #312 | Tragic 13.8% |
| Blackfeet | 0.0 /100 | #313 | Tragic 13.8% |
| Puget Sound Salish | 0.0 /100 | #314 | Tragic 13.8% |
| Alaskan Athabascans | 0.0 /100 | #315 | Tragic 13.9% |
Demographics Similar to Czechs by Female Disability
In terms of female disability, the demographic groups most similar to Czechs are Guatemalan (12.1%, a difference of 0.010%), Immigrants from Ukraine (12.1%, a difference of 0.030%), Guyanese (12.1%, a difference of 0.040%), Immigrants from Oceania (12.1%, a difference of 0.070%), and Immigrants from Guatemala (12.1%, a difference of 0.10%).
| Demographics | Rating | Rank | Female Disability |
| Danes | 72.5 /100 | #157 | Good 12.1% |
| Immigrants | Middle Africa | 72.4 /100 | #158 | Good 12.1% |
| Immigrants | Central America | 67.7 /100 | #159 | Good 12.1% |
| Immigrants | Guatemala | 66.0 /100 | #160 | Good 12.1% |
| Guyanese | 64.7 /100 | #161 | Good 12.1% |
| Immigrants | Ukraine | 64.3 /100 | #162 | Good 12.1% |
| Guatemalans | 63.8 /100 | #163 | Good 12.1% |
| Czechs | 63.6 /100 | #164 | Good 12.1% |
| Immigrants | Oceania | 61.8 /100 | #165 | Good 12.1% |
| Lithuanians | 59.5 /100 | #166 | Average 12.2% |
| Immigrants | Latin America | 59.0 /100 | #167 | Average 12.2% |
| Immigrants | Haiti | 58.8 /100 | #168 | Average 12.2% |
| Lebanese | 58.1 /100 | #169 | Average 12.2% |
| Maltese | 57.0 /100 | #170 | Average 12.2% |
| Immigrants | Southern Europe | 56.3 /100 | #171 | Average 12.2% |