Kiowa vs Immigrants from Northern Europe Male Disability
COMPARE
Kiowa
Immigrants from Northern Europe
Male Disability
Male Disability Comparison
Kiowa
Immigrants from Northern Europe
15.4%
MALE DISABILITY
0.0/ 100
METRIC RATING
342nd/ 347
METRIC RANK
11.1%
MALE DISABILITY
73.2/ 100
METRIC RATING
153rd/ 347
METRIC RANK
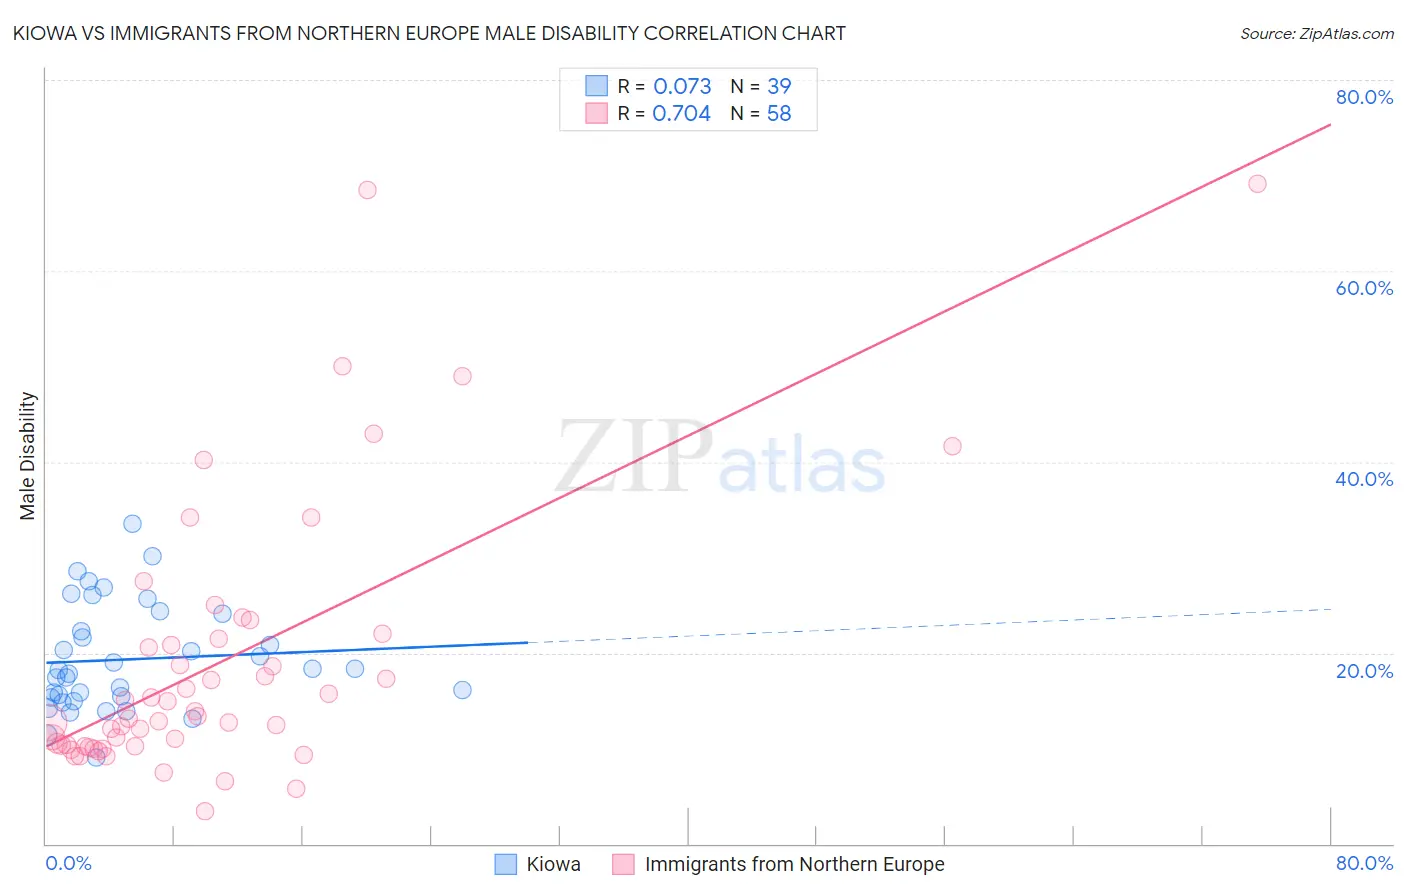
Kiowa vs Immigrants from Northern Europe Male Disability Correlation Chart
The statistical analysis conducted on geographies consisting of 56,098,760 people shows a slight positive correlation between the proportion of Kiowa and percentage of males with a disability in the United States with a correlation coefficient (R) of 0.073 and weighted average of 15.4%. Similarly, the statistical analysis conducted on geographies consisting of 477,177,667 people shows a strong positive correlation between the proportion of Immigrants from Northern Europe and percentage of males with a disability in the United States with a correlation coefficient (R) of 0.704 and weighted average of 11.1%, a difference of 39.5%.
Male Disability Correlation Summary
| Measurement | Kiowa | Immigrants from Northern Europe |
| Minimum | 9.0% | 3.4% |
| Maximum | 33.5% | 69.2% |
| Range | 24.5% | 65.8% |
| Mean | 19.3% | 19.0% |
| Median | 18.2% | 13.3% |
| Interquartile 25% (IQ1) | 15.3% | 10.2% |
| Interquartile 75% (IQ3) | 24.1% | 21.4% |
| Interquartile Range (IQR) | 8.8% | 11.2% |
| Standard Deviation (Sample) | 5.6% | 14.2% |
| Standard Deviation (Population) | 5.5% | 14.1% |
Similar Demographics by Male Disability
Demographics Similar to Kiowa by Male Disability
In terms of male disability, the demographic groups most similar to Kiowa are Choctaw (15.4%, a difference of 0.19%), Creek (15.5%, a difference of 0.66%), Puerto Rican (15.6%, a difference of 0.79%), Tsimshian (15.6%, a difference of 1.1%), and Lumbee (15.2%, a difference of 1.3%).
| Demographics | Rating | Rank | Male Disability |
| Yuman | 0.0 /100 | #333 | Tragic 14.7% |
| Cherokee | 0.0 /100 | #334 | Tragic 14.8% |
| Dutch West Indians | 0.0 /100 | #335 | Tragic 14.8% |
| Alaskan Athabascans | 0.0 /100 | #336 | Tragic 14.9% |
| Menominee | 0.0 /100 | #337 | Tragic 15.0% |
| Pueblo | 0.0 /100 | #338 | Tragic 15.0% |
| Chickasaw | 0.0 /100 | #339 | Tragic 15.1% |
| Lumbee | 0.0 /100 | #340 | Tragic 15.2% |
| Choctaw | 0.0 /100 | #341 | Tragic 15.4% |
| Kiowa | 0.0 /100 | #342 | Tragic 15.4% |
| Creek | 0.0 /100 | #343 | Tragic 15.5% |
| Puerto Ricans | 0.0 /100 | #344 | Tragic 15.6% |
| Tsimshian | 0.0 /100 | #345 | Tragic 15.6% |
| Colville | 0.0 /100 | #346 | Tragic 16.5% |
| Houma | 0.0 /100 | #347 | Tragic 17.4% |
Demographics Similar to Immigrants from Northern Europe by Male Disability
In terms of male disability, the demographic groups most similar to Immigrants from Northern Europe are Immigrants from Moldova (11.1%, a difference of 0.020%), Immigrants from Albania (11.0%, a difference of 0.090%), Cuban (11.0%, a difference of 0.12%), Immigrants from Guatemala (11.0%, a difference of 0.14%), and Immigrants from Middle Africa (11.1%, a difference of 0.16%).
| Demographics | Rating | Rank | Male Disability |
| Koreans | 77.5 /100 | #146 | Good 11.0% |
| Immigrants | Croatia | 77.3 /100 | #147 | Good 11.0% |
| Sudanese | 77.1 /100 | #148 | Good 11.0% |
| Immigrants | Denmark | 76.4 /100 | #149 | Good 11.0% |
| Immigrants | Guatemala | 75.1 /100 | #150 | Good 11.0% |
| Cubans | 74.9 /100 | #151 | Good 11.0% |
| Immigrants | Albania | 74.4 /100 | #152 | Good 11.0% |
| Immigrants | Northern Europe | 73.2 /100 | #153 | Good 11.1% |
| Immigrants | Moldova | 72.8 /100 | #154 | Good 11.1% |
| Immigrants | Middle Africa | 70.9 /100 | #155 | Good 11.1% |
| Russians | 69.8 /100 | #156 | Good 11.1% |
| Immigrants | Western Africa | 69.2 /100 | #157 | Good 11.1% |
| Latvians | 68.1 /100 | #158 | Good 11.1% |
| Guatemalans | 67.2 /100 | #159 | Good 11.1% |
| Albanians | 66.5 /100 | #160 | Good 11.1% |