Kiowa vs Immigrants from Northern Europe Householder Income Over 65 years
COMPARE
Kiowa
Immigrants from Northern Europe
Householder Income Over 65 years
Householder Income Over 65 years Comparison
Kiowa
Immigrants from Northern Europe
$51,140
HOUSEHOLDER INCOME OVER 65 YEARS
0.0/ 100
METRIC RATING
326th/ 347
METRIC RANK
$69,003
HOUSEHOLDER INCOME OVER 65 YEARS
100.0/ 100
METRIC RATING
30th/ 347
METRIC RANK
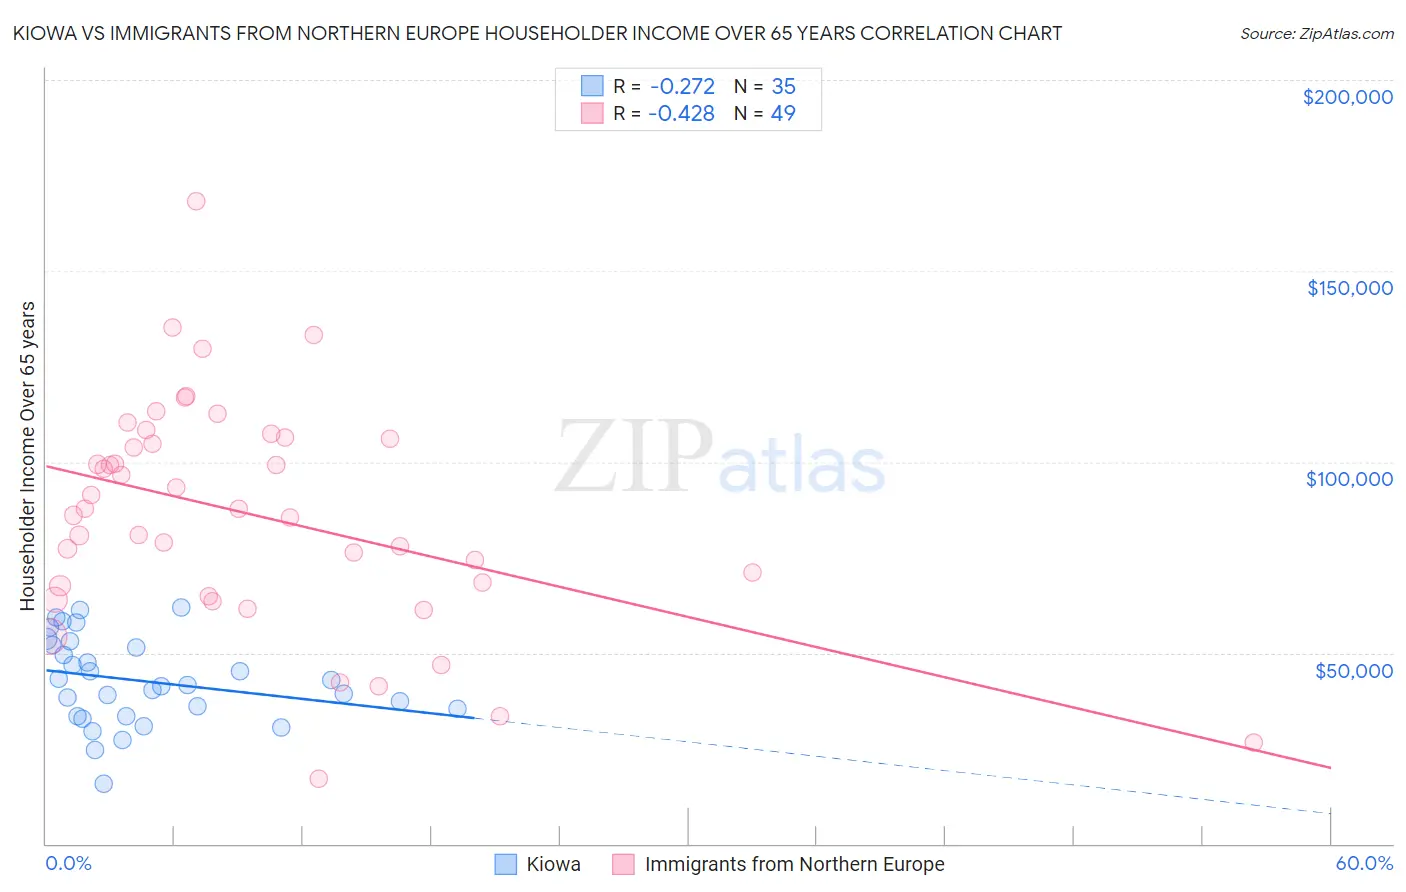
Kiowa vs Immigrants from Northern Europe Householder Income Over 65 years Correlation Chart
The statistical analysis conducted on geographies consisting of 56,056,100 people shows a weak negative correlation between the proportion of Kiowa and household income with householder over the age of 65 in the United States with a correlation coefficient (R) of -0.272 and weighted average of $51,140. Similarly, the statistical analysis conducted on geographies consisting of 475,347,578 people shows a moderate negative correlation between the proportion of Immigrants from Northern Europe and household income with householder over the age of 65 in the United States with a correlation coefficient (R) of -0.428 and weighted average of $69,003, a difference of 34.9%.
Householder Income Over 65 years Correlation Summary
| Measurement | Kiowa | Immigrants from Northern Europe |
| Minimum | $15,714 | $16,875 |
| Maximum | $61,875 | $168,214 |
| Range | $46,161 | $151,339 |
| Mean | $42,635 | $86,244 |
| Median | $41,563 | $87,597 |
| Interquartile 25% (IQ1) | $33,542 | $66,142 |
| Interquartile 75% (IQ3) | $52,128 | $106,144 |
| Interquartile Range (IQR) | $18,586 | $40,003 |
| Standard Deviation (Sample) | $11,308 | $29,698 |
| Standard Deviation (Population) | $11,146 | $29,393 |
Similar Demographics by Householder Income Over 65 years
Demographics Similar to Kiowa by Householder Income Over 65 years
In terms of householder income over 65 years, the demographic groups most similar to Kiowa are Immigrants from Haiti ($51,219, a difference of 0.15%), Bahamian ($51,000, a difference of 0.28%), Hopi ($50,925, a difference of 0.42%), Immigrants from Congo ($51,393, a difference of 0.49%), and Cajun ($51,397, a difference of 0.50%).
| Demographics | Rating | Rank | Householder Income Over 65 years |
| Immigrants | Honduras | 0.0 /100 | #319 | Tragic $51,888 |
| Colville | 0.0 /100 | #320 | Tragic $51,739 |
| Menominee | 0.0 /100 | #321 | Tragic $51,719 |
| British West Indians | 0.0 /100 | #322 | Tragic $51,463 |
| Cajuns | 0.0 /100 | #323 | Tragic $51,397 |
| Immigrants | Congo | 0.0 /100 | #324 | Tragic $51,393 |
| Immigrants | Haiti | 0.0 /100 | #325 | Tragic $51,219 |
| Kiowa | 0.0 /100 | #326 | Tragic $51,140 |
| Bahamians | 0.0 /100 | #327 | Tragic $51,000 |
| Hopi | 0.0 /100 | #328 | Tragic $50,925 |
| Blacks/African Americans | 0.0 /100 | #329 | Tragic $50,779 |
| Immigrants | Grenada | 0.0 /100 | #330 | Tragic $50,747 |
| Pima | 0.0 /100 | #331 | Tragic $50,539 |
| Dutch West Indians | 0.0 /100 | #332 | Tragic $50,475 |
| Cape Verdeans | 0.0 /100 | #333 | Tragic $50,077 |
Demographics Similar to Immigrants from Northern Europe by Householder Income Over 65 years
In terms of householder income over 65 years, the demographic groups most similar to Immigrants from Northern Europe are Afghan ($68,951, a difference of 0.070%), Immigrants from Australia ($69,164, a difference of 0.23%), Immigrants from China ($69,174, a difference of 0.25%), Asian ($68,822, a difference of 0.26%), and Immigrants from Denmark ($68,801, a difference of 0.29%).
| Demographics | Rating | Rank | Householder Income Over 65 years |
| Immigrants | Japan | 100.0 /100 | #23 | Exceptional $69,774 |
| Immigrants | Sweden | 100.0 /100 | #24 | Exceptional $69,722 |
| Immigrants | Belgium | 100.0 /100 | #25 | Exceptional $69,703 |
| Immigrants | Sri Lanka | 100.0 /100 | #26 | Exceptional $69,426 |
| Immigrants | Switzerland | 100.0 /100 | #27 | Exceptional $69,343 |
| Immigrants | China | 100.0 /100 | #28 | Exceptional $69,174 |
| Immigrants | Australia | 100.0 /100 | #29 | Exceptional $69,164 |
| Immigrants | Northern Europe | 100.0 /100 | #30 | Exceptional $69,003 |
| Afghans | 100.0 /100 | #31 | Exceptional $68,951 |
| Asians | 100.0 /100 | #32 | Exceptional $68,822 |
| Immigrants | Denmark | 100.0 /100 | #33 | Exceptional $68,801 |
| Immigrants | Ireland | 100.0 /100 | #34 | Exceptional $68,495 |
| Tongans | 100.0 /100 | #35 | Exceptional $68,235 |
| Immigrants | Austria | 99.9 /100 | #36 | Exceptional $68,208 |
| Turks | 99.9 /100 | #37 | Exceptional $68,037 |