Kiowa vs Immigrants from Somalia Disability Age Over 75
COMPARE
Kiowa
Immigrants from Somalia
Disability Age Over 75
Disability Age Over 75 Comparison
Kiowa
Immigrants from Somalia
54.2%
DISABILITY AGE OVER 75
0.0/ 100
METRIC RATING
335th/ 347
METRIC RANK
47.7%
DISABILITY AGE OVER 75
21.4/ 100
METRIC RATING
200th/ 347
METRIC RANK
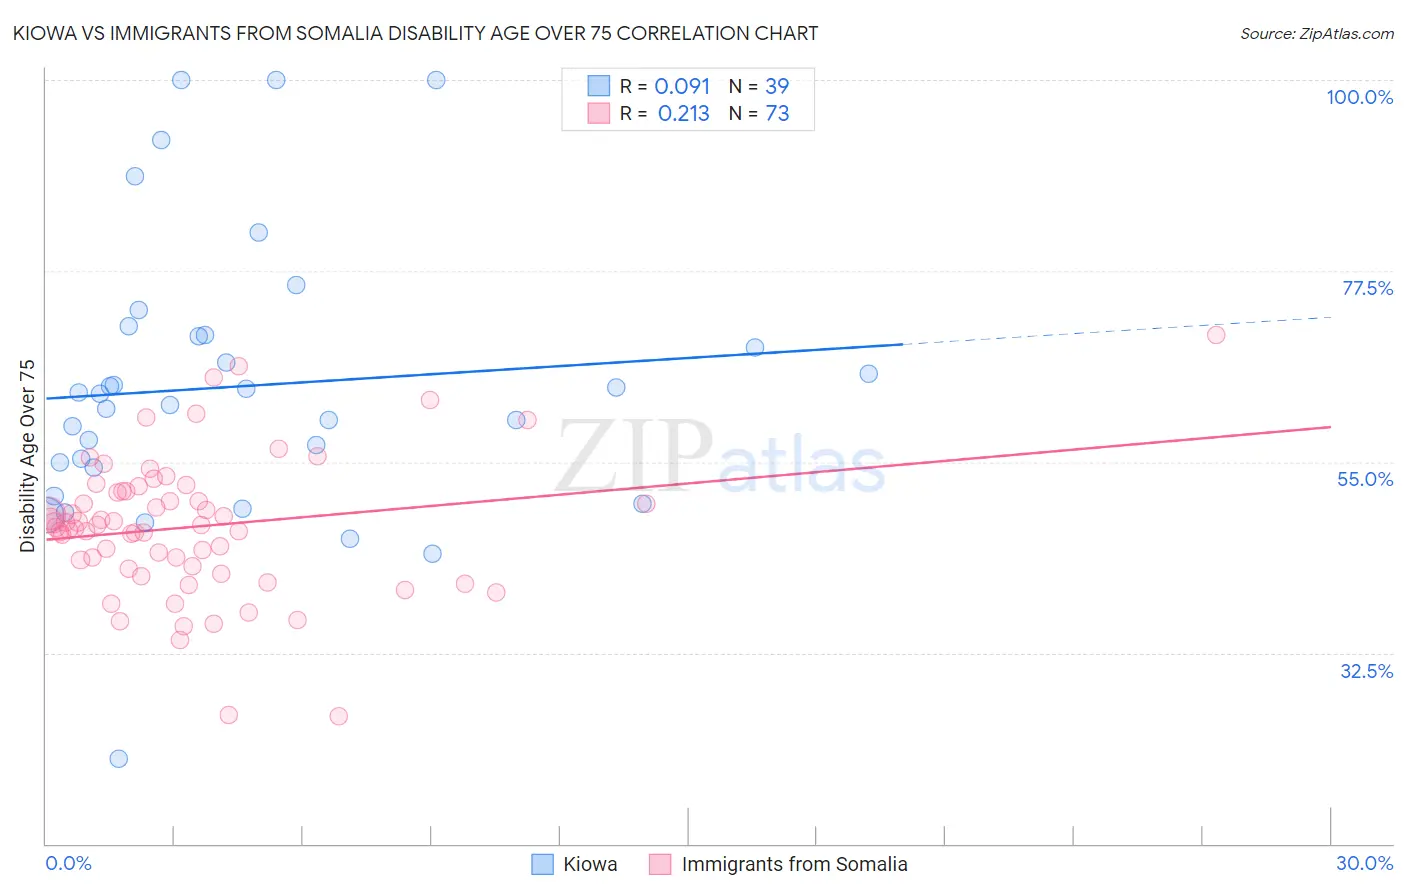
Kiowa vs Immigrants from Somalia Disability Age Over 75 Correlation Chart
The statistical analysis conducted on geographies consisting of 56,070,567 people shows a slight positive correlation between the proportion of Kiowa and percentage of population with a disability over the age of 75 in the United States with a correlation coefficient (R) of 0.091 and weighted average of 54.2%. Similarly, the statistical analysis conducted on geographies consisting of 92,093,367 people shows a weak positive correlation between the proportion of Immigrants from Somalia and percentage of population with a disability over the age of 75 in the United States with a correlation coefficient (R) of 0.213 and weighted average of 47.7%, a difference of 13.7%.
Disability Age Over 75 Correlation Summary
| Measurement | Kiowa | Immigrants from Somalia |
| Minimum | 20.0% | 25.0% |
| Maximum | 100.0% | 69.9% |
| Range | 80.0% | 44.9% |
| Mean | 63.9% | 47.4% |
| Median | 63.0% | 47.6% |
| Interquartile 25% (IQ1) | 54.3% | 42.6% |
| Interquartile 75% (IQ3) | 69.9% | 51.6% |
| Interquartile Range (IQR) | 15.6% | 9.0% |
| Standard Deviation (Sample) | 16.5% | 8.2% |
| Standard Deviation (Population) | 16.3% | 8.2% |
Similar Demographics by Disability Age Over 75
Demographics Similar to Kiowa by Disability Age Over 75
In terms of disability age over 75, the demographic groups most similar to Kiowa are Immigrants from Armenia (54.3%, a difference of 0.17%), Yuman (54.4%, a difference of 0.33%), Alaskan Athabascan (54.0%, a difference of 0.53%), Apache (53.6%, a difference of 1.2%), and Colville (55.4%, a difference of 2.1%).
| Demographics | Rating | Rank | Disability Age Over 75 |
| Choctaw | 0.0 /100 | #328 | Tragic 52.7% |
| Alaska Natives | 0.0 /100 | #329 | Tragic 52.8% |
| Puerto Ricans | 0.0 /100 | #330 | Tragic 52.9% |
| Hopi | 0.0 /100 | #331 | Tragic 52.9% |
| Natives/Alaskans | 0.0 /100 | #332 | Tragic 53.1% |
| Apache | 0.0 /100 | #333 | Tragic 53.6% |
| Alaskan Athabascans | 0.0 /100 | #334 | Tragic 54.0% |
| Kiowa | 0.0 /100 | #335 | Tragic 54.2% |
| Immigrants | Armenia | 0.0 /100 | #336 | Tragic 54.3% |
| Yuman | 0.0 /100 | #337 | Tragic 54.4% |
| Colville | 0.0 /100 | #338 | Tragic 55.4% |
| Pima | 0.0 /100 | #339 | Tragic 55.8% |
| Pueblo | 0.0 /100 | #340 | Tragic 55.9% |
| Houma | 0.0 /100 | #341 | Tragic 56.2% |
| Lumbee | 0.0 /100 | #342 | Tragic 56.2% |
Demographics Similar to Immigrants from Somalia by Disability Age Over 75
In terms of disability age over 75, the demographic groups most similar to Immigrants from Somalia are Immigrants from Cuba (47.7%, a difference of 0.020%), Immigrants from Bahamas (47.7%, a difference of 0.020%), Immigrants from Eritrea (47.7%, a difference of 0.030%), Trinidadian and Tobagonian (47.7%, a difference of 0.050%), and Immigrants from Ukraine (47.7%, a difference of 0.060%).
| Demographics | Rating | Rank | Disability Age Over 75 |
| Ottawa | 28.1 /100 | #193 | Fair 47.6% |
| Immigrants | Lebanon | 26.5 /100 | #194 | Fair 47.6% |
| Immigrants | Trinidad and Tobago | 25.3 /100 | #195 | Fair 47.6% |
| Immigrants | Portugal | 23.8 /100 | #196 | Fair 47.6% |
| Pakistanis | 23.4 /100 | #197 | Fair 47.7% |
| Immigrants | Ukraine | 23.2 /100 | #198 | Fair 47.7% |
| Immigrants | Eritrea | 22.4 /100 | #199 | Fair 47.7% |
| Immigrants | Somalia | 21.4 /100 | #200 | Fair 47.7% |
| Immigrants | Cuba | 20.9 /100 | #201 | Fair 47.7% |
| Immigrants | Bahamas | 20.7 /100 | #202 | Fair 47.7% |
| Trinidadians and Tobagonians | 20.0 /100 | #203 | Fair 47.7% |
| Nigerians | 19.2 /100 | #204 | Poor 47.7% |
| Immigrants | Ghana | 19.1 /100 | #205 | Poor 47.7% |
| Jamaicans | 19.0 /100 | #206 | Poor 47.7% |
| Immigrants | Syria | 17.4 /100 | #207 | Poor 47.8% |