Kenyan vs Pennsylvania German Disability Age 35 to 64

COMPARE

Kenyan
Race
Ancestry
AfghanAfricanAlaska NativeAlaskan AthabascanAlbanianAleutAlsatianAmericanApacheArabArapahoArgentineanArmenianAssyrian/Chaldean/SyriacAustralianAustrianBahamianBangladeshiBarbadianBasqueBelgianBelizeanBermudanBhutaneseBlackfeetBolivianBrazilianBritishBritish West IndianBulgarianBurmeseCajunCambodianCanadianCape VerdeanCarpatho RusynCelticCentral AmericanCentral American IndianCherokeeCheyenneChickasawChileanChineseChippewaChoctawColombianColvilleComancheCosta RicanCreeCreekCroatianCrowCubanCypriotCzechCzechoslovakianDanishDelawareDominicanDutchDutch West IndianEastern EuropeanEcuadorianEgyptianEnglishEstonianEthiopianEuropeanFijianFilipinoFinnishFrenchFrench American IndianFrench CanadianGermanGerman RussianGhanaianGreekGuamanian/ChamorroGuatemalanGuyaneseHaitianHmongHonduranHopiHoumaHungarianIcelanderIndian (Asian)IndonesianInupiatIranianIraqiIrishIroquoisIsraeliItalianJamaicanJapaneseJordanianKenyanKiowaKoreanLaotianLatvianLebaneseLiberianLithuanianLumbeeLuxembourgerMacedonianMalaysianMalteseMarshalleseMenomineeMexicanMexican American IndianMongolianMoroccanNative HawaiianNavajoNepaleseNew ZealanderNicaraguanNigerianNorthern EuropeanNorwegianOkinawanOsageOttawaPaiutePakistaniPalestinianPanamanianParaguayanPeruvianPimaPolishPortuguesePotawatomiPuebloPuerto RicanPuget Sound SalishRomanianRussianSalvadoranSamoanScandinavianScotch-IrishScottishSeminoleSenegaleseSerbianShoshoneSierra LeoneanSiouxSlavicSlovakSloveneSomaliSouth AfricanSouth AmericanSouth American IndianSoviet UnionSpaniardSpanishSpanish AmericanSpanish American IndianSri LankanSubsaharan AfricanSudaneseSwedishSwissSyrianTaiwaneseThaiTlingit-HaidaTohono O'OdhamTonganTrinidadian and TobagonianTsimshianTurkishU.S. Virgin IslanderUgandanUkrainianUruguayanUteVenezuelanVietnameseWelshWest IndianYakamaYaquiYugoslavianYumanYup'ikZimbabwean
Immigration
NonimmigrantsImmigrantsAfghanistanAfricaAlbaniaArgentinaArmeniaAsiaAustraliaAustriaBahamasBangladeshBarbadosBelarusBelgiumBelizeBoliviaBosnia and HerzegovinaBrazilBulgariaBurma/MyanmarCabo VerdeCambodiaCameroonCanadaCaribbeanCentral AmericaChileChinaColombiaCongoCosta RicaCroatiaCubaCzechoslovakiaDenmarkDominicaDominican RepublicEastern AfricaEastern AsiaEastern EuropeEcuadorEgyptEl SalvadorEnglandEritreaEthiopiaEuropeFijiFranceGermanyGhanaGreeceGrenadaGuatemalaGuyanaHaitiHondurasHong KongHungaryIndiaIndonesiaIranIraqIrelandIsraelItalyJamaicaJapanJordanKazakhstanKenyaKoreaKuwaitLaosLatin AmericaLatviaLebanonLiberiaLithuaniaMalaysiaMexicoMicronesiaMiddle AfricaMoldovaMoroccoNepalNetherlandsNicaraguaNigeriaNorth AmericaNorth MacedoniaNorthern AfricaNorthern EuropeNorwayOceaniaPakistanPanamaPeruPhilippinesPolandPortugalRomaniaRussiaSaudi ArabiaScotlandSenegalSerbiaSierra LeoneSingaporeSomaliaSouth AfricaSouth AmericaSouth Central AsiaSouth Eastern AsiaSouthern EuropeSpainSri LankaSt. Vincent and the GrenadinesSudanSwedenSwitzerlandSyriaTaiwanThailandTrinidad and TobagoTurkeyUgandaUkraineUruguayUzbekistanVenezuelaVietnamWest IndiesWestern AfricaWestern AsiaWestern EuropeYemenZaireZimbabweAzores
Pennsylvania German
Race
Ancestry
AfghanAfricanAlaska NativeAlaskan AthabascanAlbanianAleutAlsatianAmericanApacheArabArapahoArgentineanArmenianAssyrian/Chaldean/SyriacAustralianAustrianBahamianBangladeshiBarbadianBasqueBelgianBelizeanBermudanBhutaneseBlackfeetBolivianBrazilianBritishBritish West IndianBulgarianBurmeseCajunCambodianCanadianCape VerdeanCarpatho RusynCelticCentral AmericanCentral American IndianCherokeeCheyenneChickasawChileanChineseChippewaChoctawColombianColvilleComancheCosta RicanCreeCreekCroatianCrowCubanCypriotCzechCzechoslovakianDanishDelawareDominicanDutchDutch West IndianEastern EuropeanEcuadorianEgyptianEnglishEstonianEthiopianEuropeanFijianFilipinoFinnishFrenchFrench American IndianFrench CanadianGermanGerman RussianGhanaianGreekGuamanian/ChamorroGuatemalanGuyaneseHaitianHmongHonduranHopiHoumaHungarianIcelanderIndian (Asian)IndonesianInupiatIranianIraqiIrishIroquoisIsraeliItalianJamaicanJapaneseJordanianKiowaKoreanLaotianLatvianLebaneseLiberianLithuanianLumbeeLuxembourgerMacedonianMalaysianMalteseMarshalleseMenomineeMexicanMexican American IndianMongolianMoroccanNative HawaiianNavajoNepaleseNew ZealanderNicaraguanNigerianNorthern EuropeanNorwegianOkinawanOsageOttawaPaiutePakistaniPalestinianPanamanianParaguayanPennsylvania GermanPeruvianPimaPolishPortuguesePotawatomiPuebloPuerto RicanPuget Sound SalishRomanianRussianSalvadoranSamoanScandinavianScotch-IrishScottishSeminoleSenegaleseSerbianShoshoneSierra LeoneanSiouxSlavicSlovakSloveneSomaliSouth AfricanSouth AmericanSouth American IndianSoviet UnionSpaniardSpanishSpanish AmericanSpanish American IndianSri LankanSubsaharan AfricanSudaneseSwedishSwissSyrianTaiwaneseThaiTlingit-HaidaTohono O'OdhamTonganTrinidadian and TobagonianTsimshianTurkishU.S. Virgin IslanderUgandanUkrainianUruguayanUteVenezuelanVietnameseWelshWest IndianYakamaYaquiYugoslavianYumanYup'ikZimbabwean
Immigration
NonimmigrantsImmigrantsAfghanistanAfricaAlbaniaArgentinaArmeniaAsiaAustraliaAustriaBahamasBangladeshBarbadosBelarusBelgiumBelizeBoliviaBosnia and HerzegovinaBrazilBulgariaBurma/MyanmarCabo VerdeCambodiaCameroonCanadaCaribbeanCentral AmericaChileChinaColombiaCongoCosta RicaCroatiaCubaCzechoslovakiaDenmarkDominicaDominican RepublicEastern AfricaEastern AsiaEastern EuropeEcuadorEgyptEl SalvadorEnglandEritreaEthiopiaEuropeFijiFranceGermanyGhanaGreeceGrenadaGuatemalaGuyanaHaitiHondurasHong KongHungaryIndiaIndonesiaIranIraqIrelandIsraelItalyJamaicaJapanJordanKazakhstanKenyaKoreaKuwaitLaosLatin AmericaLatviaLebanonLiberiaLithuaniaMalaysiaMexicoMicronesiaMiddle AfricaMoldovaMoroccoNepalNetherlandsNicaraguaNigeriaNorth AmericaNorth MacedoniaNorthern AfricaNorthern EuropeNorwayOceaniaPakistanPanamaPeruPhilippinesPolandPortugalRomaniaRussiaSaudi ArabiaScotlandSenegalSerbiaSierra LeoneSingaporeSomaliaSouth AfricaSouth AmericaSouth Central AsiaSouth Eastern AsiaSouthern EuropeSpainSri LankaSt. Vincent and the GrenadinesSudanSwedenSwitzerlandSyriaTaiwanThailandTrinidad and TobagoTurkeyUgandaUkraineUruguayUzbekistanVenezuelaVietnamWest IndiesWestern AfricaWestern AsiaWestern EuropeYemenZaireZimbabweAzores
Disability Age 35 to 64
Income
Poverty
Unemployment
Labor Participation
Family Structure
Vehicle Availability
Education Level
Disability

Disability Age 35 to 64 Comparison

Kenyans

Pennsylvania Germans

Fair
Tragic
11.4%
DISABILITY AGE 35 TO 64
39.2/ 100
METRIC RATING
184th/ 347
METRIC RANK
12.8%
DISABILITY AGE 35 TO 64
0.1/ 100
METRIC RATING
273rd/ 347
METRIC RANK

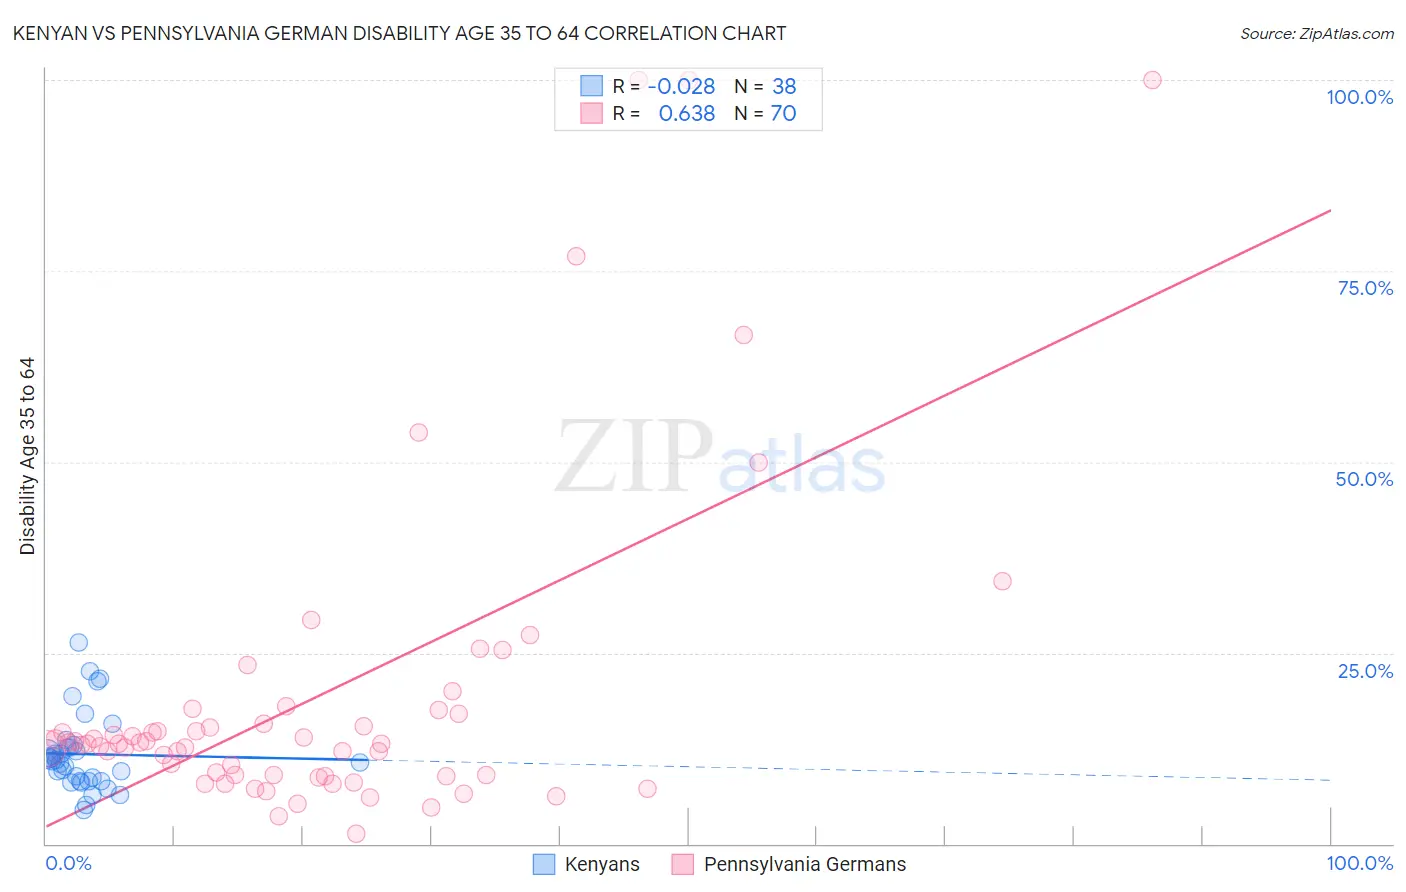
Kenyan vs Pennsylvania German Disability Age 35 to 64 Correlation Chart

The statistical analysis conducted on geographies consisting of 168,160,761 people shows no correlation between the proportion of Kenyans and percentage of population with a disability between the ages 34 and 64 in the United States with a correlation coefficient (R) of -0.028 and weighted average of 11.4%. Similarly, the statistical analysis conducted on geographies consisting of 234,029,546 people shows a significant positive correlation between the proportion of Pennsylvania Germans and percentage of population with a disability between the ages 34 and 64 in the United States with a correlation coefficient (R) of 0.638 and weighted average of 12.8%, a difference of 13.0%.
Kenyan vs Pennsylvania German Disability Age 35 to 64

Disability Age 35 to 64 Correlation Summary

MeasurementKenyanPennsylvania German
Minimum4.5%1.3%
Maximum26.3%100.0%
Range21.8%98.7%
Mean11.7%19.5%
Median10.9%13.1%
Interquartile 25% (IQ1)8.2%9.0%
Interquartile 75% (IQ3)12.5%16.9%
Interquartile Range (IQR)4.3%8.0%
Standard Deviation (Sample)4.9%21.6%
Standard Deviation (Population)4.9%21.4%

Similar Demographics by Disability Age 35 to 64

Demographics Similar to Kenyans by Disability Age 35 to 64

In terms of disability age 35 to 64, the demographic groups most similar to Kenyans are Immigrants from Oceania (11.4%, a difference of 0.030%), Icelander (11.4%, a difference of 0.040%), Trinidadian and Tobagonian (11.4%, a difference of 0.13%), Immigrants from Caribbean (11.3%, a difference of 0.19%), and Immigrants from Barbados (11.3%, a difference of 0.20%).
DemographicsRating | RankDisability Age 35 to 64
Immigrants | Eastern Africa
42.2
/100
|
#177
Average
11.3%
Poles
42.0
/100
|
#178
Average
11.3%
Immigrants | Barbados
41.6
/100
|
#179
Average
11.3%
Immigrants | Caribbean
41.5
/100
|
#180
Average
11.3%
Trinidadians and Tobagonians
40.8
/100
|
#181
Average
11.4%
Icelanders
39.7
/100
|
#182
Fair
11.4%
Immigrants | Oceania
39.5
/100
|
#183
Fair
11.4%
Kenyans
39.2
/100
|
#184
Fair
11.4%
Danes
36.8
/100
|
#185
Fair
11.4%
Slovenes
36.6
/100
|
#186
Fair
11.4%
Immigrants | Bosnia and Herzegovina
35.2
/100
|
#187
Fair
11.4%
Northern Europeans
34.9
/100
|
#188
Fair
11.4%
Hungarians
34.6
/100
|
#189
Fair
11.4%
Immigrants | Nigeria
32.5
/100
|
#190
Fair
11.4%
Swedes
31.3
/100
|
#191
Fair
11.4%

Demographics Similar to Pennsylvania Germans by Disability Age 35 to 64

In terms of disability age 35 to 64, the demographic groups most similar to Pennsylvania Germans are Celtic (12.9%, a difference of 0.030%), U.S. Virgin Islander (12.8%, a difference of 0.080%), Dominican (12.9%, a difference of 0.16%), Nepalese (12.8%, a difference of 0.21%), and Somali (12.9%, a difference of 0.28%).
DemographicsRating | RankDisability Age 35 to 64
Whites/Caucasians
0.3
/100
|
#266
Tragic
12.6%
Sub-Saharan Africans
0.2
/100
|
#267
Tragic
12.6%
Immigrants | Dominica
0.2
/100
|
#268
Tragic
12.7%
Spanish
0.2
/100
|
#269
Tragic
12.7%
French
0.2
/100
|
#270
Tragic
12.7%
Nepalese
0.1
/100
|
#271
Tragic
12.8%
U.S. Virgin Islanders
0.1
/100
|
#272
Tragic
12.8%
Pennsylvania Germans
0.1
/100
|
#273
Tragic
12.8%
Celtics
0.1
/100
|
#274
Tragic
12.9%
Dominicans
0.1
/100
|
#275
Tragic
12.9%
Somalis
0.1
/100
|
#276
Tragic
12.9%
Immigrants | Dominican Republic
0.1
/100
|
#277
Tragic
12.9%
French Canadians
0.1
/100
|
#278
Tragic
12.9%
Immigrants | Micronesia
0.1
/100
|
#279
Tragic
12.9%
Liberians
0.1
/100
|
#280
Tragic
12.9%