Kenyan vs Native Hawaiian Disability Age Over 75
COMPARE
Kenyan
Native Hawaiian
Disability Age Over 75
Disability Age Over 75 Comparison
Kenyans
Native Hawaiians
47.2%
DISABILITY AGE OVER 75
58.8/ 100
METRIC RATING
168th/ 347
METRIC RANK
48.3%
DISABILITY AGE OVER 75
2.2/ 100
METRIC RATING
241st/ 347
METRIC RANK
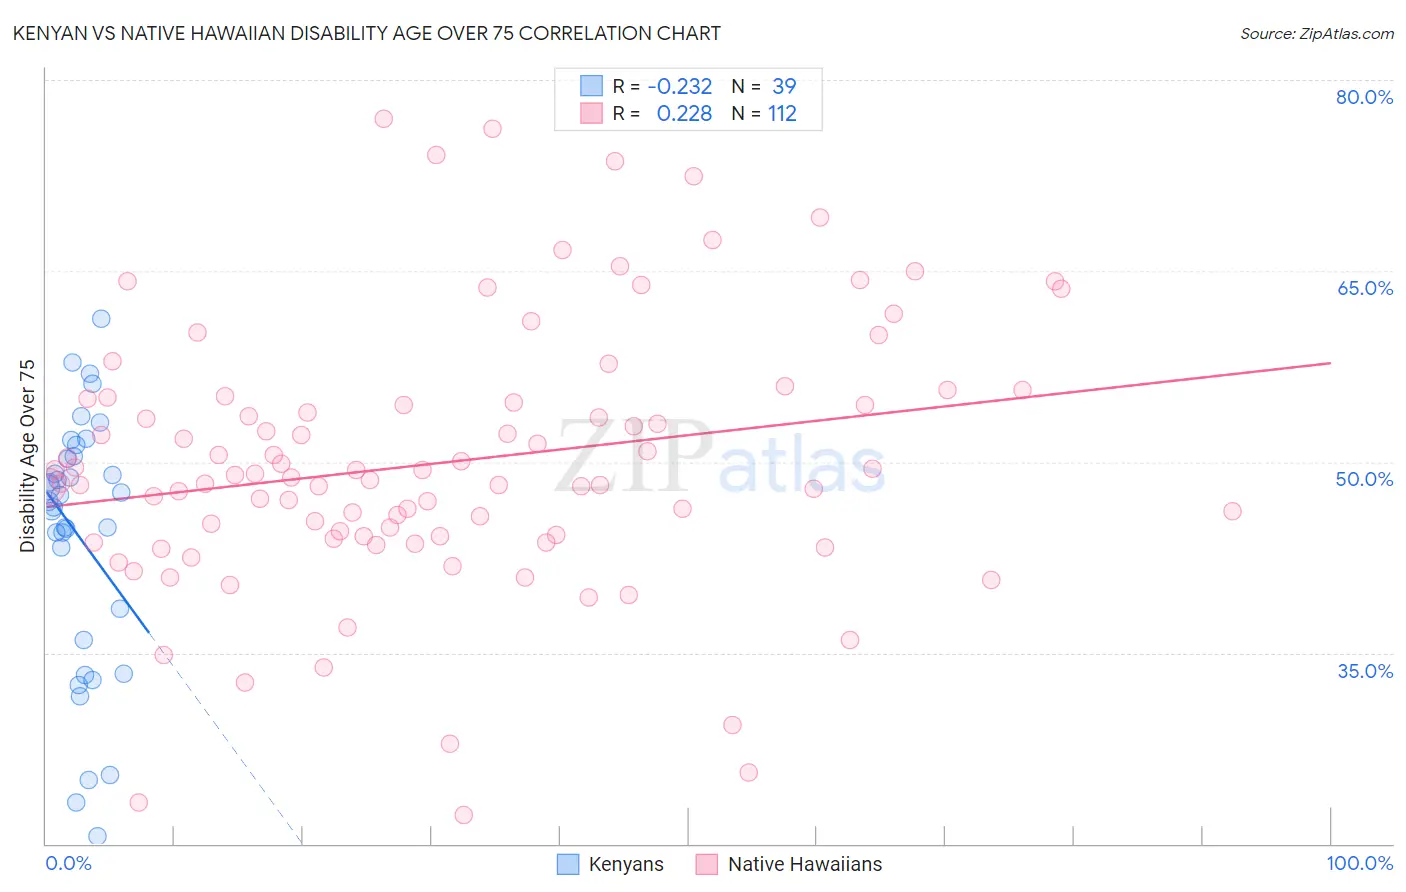
Kenyan vs Native Hawaiian Disability Age Over 75 Correlation Chart
The statistical analysis conducted on geographies consisting of 167,961,440 people shows a weak negative correlation between the proportion of Kenyans and percentage of population with a disability over the age of 75 in the United States with a correlation coefficient (R) of -0.232 and weighted average of 47.2%. Similarly, the statistical analysis conducted on geographies consisting of 331,313,061 people shows a weak positive correlation between the proportion of Native Hawaiians and percentage of population with a disability over the age of 75 in the United States with a correlation coefficient (R) of 0.228 and weighted average of 48.3%, a difference of 2.3%.
Disability Age Over 75 Correlation Summary
| Measurement | Kenyan | Native Hawaiian |
| Minimum | 20.6% | 22.3% |
| Maximum | 61.2% | 76.9% |
| Range | 40.7% | 54.6% |
| Mean | 44.1% | 50.0% |
| Median | 46.9% | 48.9% |
| Interquartile 25% (IQ1) | 36.0% | 44.1% |
| Interquartile 75% (IQ3) | 50.5% | 54.8% |
| Interquartile Range (IQR) | 14.4% | 10.7% |
| Standard Deviation (Sample) | 10.0% | 10.5% |
| Standard Deviation (Population) | 9.9% | 10.4% |
Similar Demographics by Disability Age Over 75
Demographics Similar to Kenyans by Disability Age Over 75
In terms of disability age over 75, the demographic groups most similar to Kenyans are Celtic (47.2%, a difference of 0.0%), German Russian (47.3%, a difference of 0.060%), Moroccan (47.2%, a difference of 0.10%), Immigrants from Africa (47.3%, a difference of 0.12%), and Immigrants from Zimbabwe (47.2%, a difference of 0.13%).
| Demographics | Rating | Rank | Disability Age Over 75 |
| South American Indians | 68.1 /100 | #161 | Good 47.1% |
| Pennsylvania Germans | 66.0 /100 | #162 | Good 47.2% |
| Immigrants | Eastern Africa | 65.5 /100 | #163 | Good 47.2% |
| French | 64.6 /100 | #164 | Good 47.2% |
| Immigrants | Zimbabwe | 64.4 /100 | #165 | Good 47.2% |
| Immigrants | Sierra Leone | 64.4 /100 | #166 | Good 47.2% |
| Moroccans | 62.9 /100 | #167 | Good 47.2% |
| Kenyans | 58.8 /100 | #168 | Average 47.2% |
| Celtics | 58.7 /100 | #169 | Average 47.2% |
| German Russians | 56.2 /100 | #170 | Average 47.3% |
| Immigrants | Africa | 53.6 /100 | #171 | Average 47.3% |
| Scotch-Irish | 52.5 /100 | #172 | Average 47.3% |
| Alsatians | 51.9 /100 | #173 | Average 47.3% |
| Whites/Caucasians | 50.0 /100 | #174 | Average 47.3% |
| Immigrants | Haiti | 49.7 /100 | #175 | Average 47.3% |
Demographics Similar to Native Hawaiians by Disability Age Over 75
In terms of disability age over 75, the demographic groups most similar to Native Hawaiians are French American Indian (48.3%, a difference of 0.0%), Tongan (48.3%, a difference of 0.010%), Immigrants from Caribbean (48.4%, a difference of 0.040%), Immigrants from Thailand (48.3%, a difference of 0.12%), and Afghan (48.4%, a difference of 0.13%).
| Demographics | Rating | Rank | Disability Age Over 75 |
| Sub-Saharan Africans | 3.8 /100 | #234 | Tragic 48.2% |
| Hmong | 3.8 /100 | #235 | Tragic 48.2% |
| Immigrants | Nicaragua | 3.2 /100 | #236 | Tragic 48.2% |
| Immigrants | St. Vincent and the Grenadines | 3.2 /100 | #237 | Tragic 48.2% |
| Nicaraguans | 3.0 /100 | #238 | Tragic 48.3% |
| Immigrants | Thailand | 2.8 /100 | #239 | Tragic 48.3% |
| Tongans | 2.3 /100 | #240 | Tragic 48.3% |
| Native Hawaiians | 2.2 /100 | #241 | Tragic 48.3% |
| French American Indians | 2.2 /100 | #242 | Tragic 48.3% |
| Immigrants | Caribbean | 2.1 /100 | #243 | Tragic 48.4% |
| Afghans | 1.8 /100 | #244 | Tragic 48.4% |
| Americans | 1.7 /100 | #245 | Tragic 48.4% |
| Chippewa | 1.6 /100 | #246 | Tragic 48.4% |
| Iroquois | 1.6 /100 | #247 | Tragic 48.4% |
| Sri Lankans | 1.4 /100 | #248 | Tragic 48.5% |