Kenyan vs Immigrants from Korea Family Households with Children
COMPARE
Kenyan
Immigrants from Korea
Family Households with Children
Family Households with Children Comparison
Kenyans
Immigrants from Korea
28.4%
FAMILY HOUSEHOLDS WITH CHILDREN
99.8/ 100
METRIC RATING
82nd/ 347
METRIC RANK
28.5%
FAMILY HOUSEHOLDS WITH CHILDREN
99.9/ 100
METRIC RATING
69th/ 347
METRIC RANK
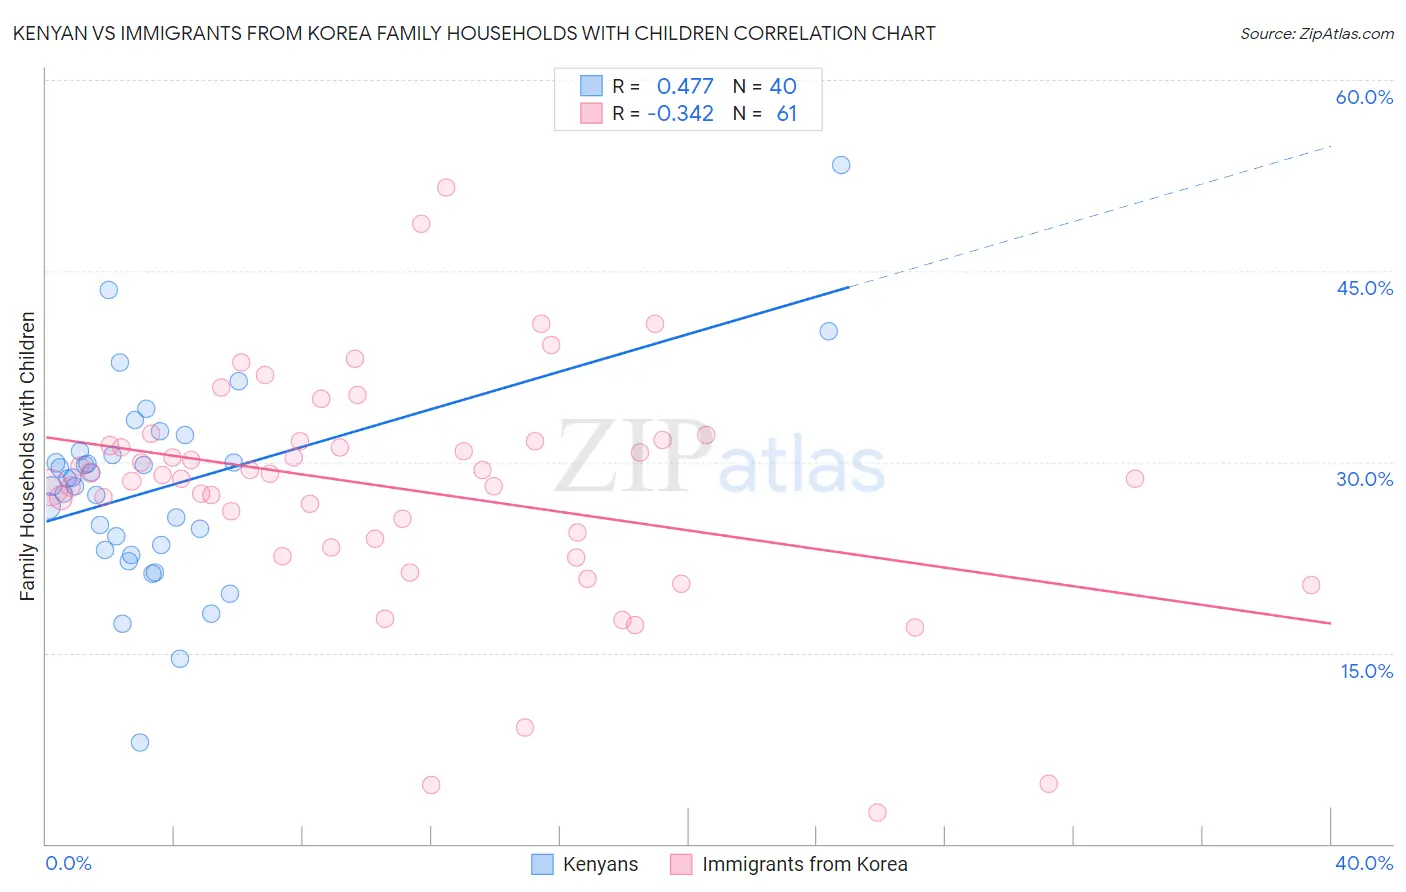
Kenyan vs Immigrants from Korea Family Households with Children Correlation Chart
The statistical analysis conducted on geographies consisting of 168,136,016 people shows a moderate positive correlation between the proportion of Kenyans and percentage of family households with children in the United States with a correlation coefficient (R) of 0.477 and weighted average of 28.4%. Similarly, the statistical analysis conducted on geographies consisting of 415,788,077 people shows a mild negative correlation between the proportion of Immigrants from Korea and percentage of family households with children in the United States with a correlation coefficient (R) of -0.342 and weighted average of 28.5%, a difference of 0.46%.
Family Households with Children Correlation Summary
| Measurement | Kenyan | Immigrants from Korea |
| Minimum | 7.9% | 2.4% |
| Maximum | 53.3% | 51.5% |
| Range | 45.4% | 49.1% |
| Mean | 28.0% | 27.8% |
| Median | 28.4% | 29.0% |
| Interquartile 25% (IQ1) | 23.3% | 23.6% |
| Interquartile 75% (IQ3) | 30.7% | 31.6% |
| Interquartile Range (IQR) | 7.4% | 8.0% |
| Standard Deviation (Sample) | 7.9% | 9.0% |
| Standard Deviation (Population) | 7.8% | 9.0% |
Demographics Similar to Kenyans and Immigrants from Korea by Family Households with Children
In terms of family households with children, the demographic groups most similar to Kenyans are South American (28.4%, a difference of 0.040%), Nicaraguan (28.4%, a difference of 0.050%), Costa Rican (28.4%, a difference of 0.050%), Native/Alaskan (28.4%, a difference of 0.070%), and Immigrants from Syria (28.4%, a difference of 0.070%). Similarly, the demographic groups most similar to Immigrants from Korea are Houma (28.5%, a difference of 0.020%), Honduran (28.5%, a difference of 0.040%), Immigrants from Egypt (28.5%, a difference of 0.040%), Ghanaian (28.5%, a difference of 0.040%), and Immigrants from Honduras (28.5%, a difference of 0.050%).
| Demographics | Rating | Rank | Family Households with Children |
| Hondurans | 99.9 /100 | #65 | Exceptional 28.5% |
| Immigrants | Egypt | 99.9 /100 | #66 | Exceptional 28.5% |
| Ghanaians | 99.9 /100 | #67 | Exceptional 28.5% |
| Houma | 99.9 /100 | #68 | Exceptional 28.5% |
| Immigrants | Korea | 99.9 /100 | #69 | Exceptional 28.5% |
| Immigrants | Honduras | 99.9 /100 | #70 | Exceptional 28.5% |
| Burmese | 99.9 /100 | #71 | Exceptional 28.5% |
| Immigrants | Indonesia | 99.9 /100 | #72 | Exceptional 28.5% |
| Iraqis | 99.9 /100 | #73 | Exceptional 28.5% |
| Laotians | 99.9 /100 | #74 | Exceptional 28.5% |
| Immigrants | Jordan | 99.9 /100 | #75 | Exceptional 28.4% |
| Immigrants | Sri Lanka | 99.9 /100 | #76 | Exceptional 28.4% |
| Nigerians | 99.8 /100 | #77 | Exceptional 28.4% |
| Immigrants | Nepal | 99.8 /100 | #78 | Exceptional 28.4% |
| Immigrants | Iraq | 99.8 /100 | #79 | Exceptional 28.4% |
| Natives/Alaskans | 99.8 /100 | #80 | Exceptional 28.4% |
| South Americans | 99.8 /100 | #81 | Exceptional 28.4% |
| Kenyans | 99.8 /100 | #82 | Exceptional 28.4% |
| Nicaraguans | 99.8 /100 | #83 | Exceptional 28.4% |
| Costa Ricans | 99.8 /100 | #84 | Exceptional 28.4% |
| Immigrants | Syria | 99.8 /100 | #85 | Exceptional 28.4% |