Japanese vs Hungarian Hearing Disability
COMPARE
Japanese
Hungarian
Hearing Disability
Hearing Disability Comparison
Japanese
Hungarians
3.0%
HEARING DISABILITY
46.0/ 100
METRIC RATING
178th/ 347
METRIC RANK
3.4%
HEARING DISABILITY
0.4/ 100
METRIC RATING
251st/ 347
METRIC RANK
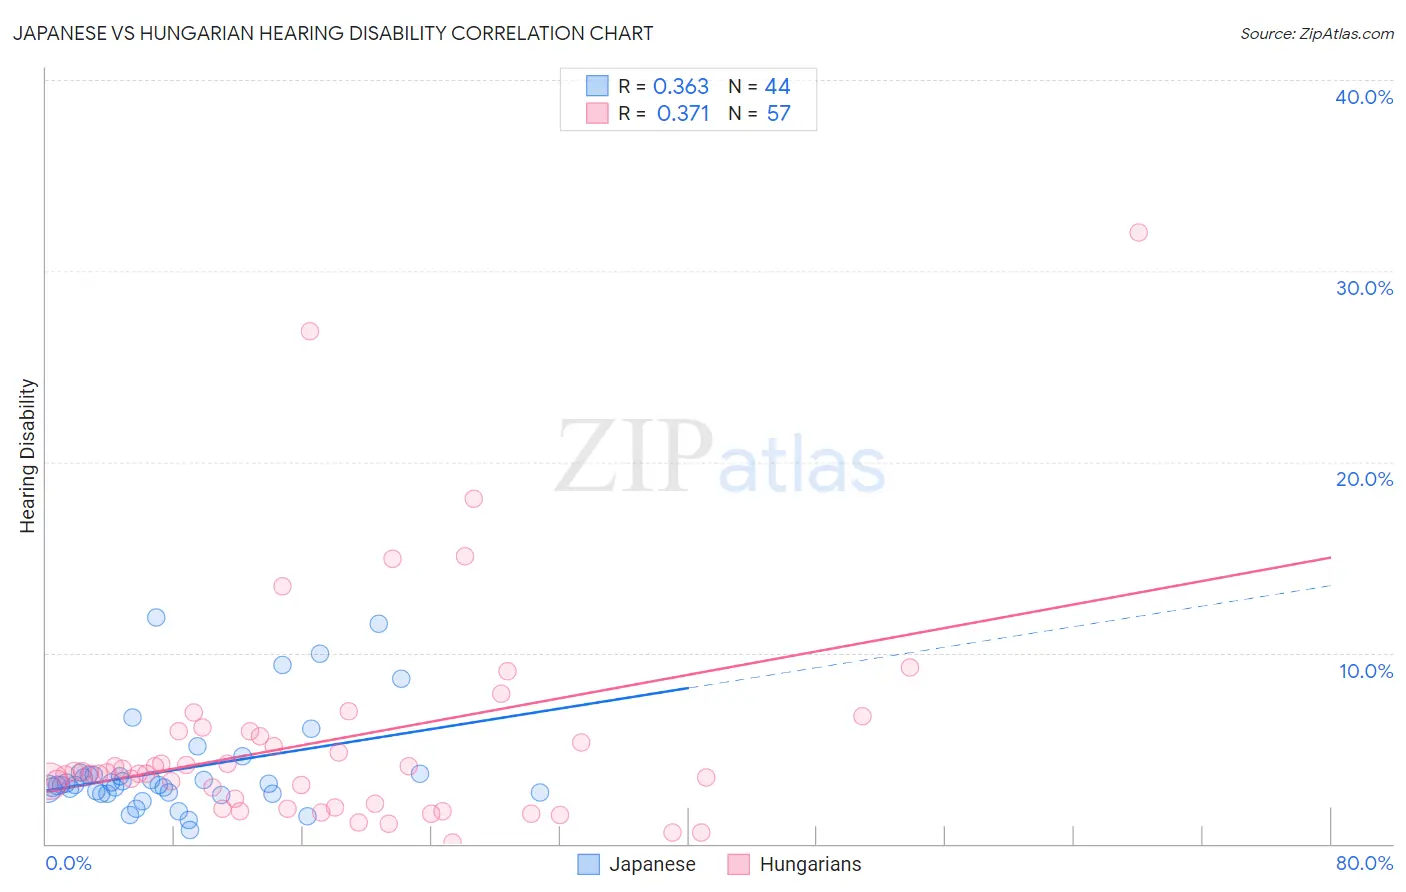
Japanese vs Hungarian Hearing Disability Correlation Chart
The statistical analysis conducted on geographies consisting of 249,105,269 people shows a mild positive correlation between the proportion of Japanese and percentage of population with hearing disability in the United States with a correlation coefficient (R) of 0.363 and weighted average of 3.0%. Similarly, the statistical analysis conducted on geographies consisting of 485,961,272 people shows a mild positive correlation between the proportion of Hungarians and percentage of population with hearing disability in the United States with a correlation coefficient (R) of 0.371 and weighted average of 3.4%, a difference of 12.6%.
Hearing Disability Correlation Summary
| Measurement | Japanese | Hungarian |
| Minimum | 0.75% | 0.091% |
| Maximum | 11.9% | 32.0% |
| Range | 11.1% | 31.9% |
| Mean | 3.9% | 5.4% |
| Median | 3.1% | 3.7% |
| Interquartile 25% (IQ1) | 2.7% | 2.0% |
| Interquartile 75% (IQ3) | 3.7% | 5.9% |
| Interquartile Range (IQR) | 1.0% | 3.9% |
| Standard Deviation (Sample) | 2.6% | 5.9% |
| Standard Deviation (Population) | 2.6% | 5.8% |
Similar Demographics by Hearing Disability
Demographics Similar to Japanese by Hearing Disability
In terms of hearing disability, the demographic groups most similar to Japanese are Immigrants from Philippines (3.0%, a difference of 0.040%), Panamanian (3.0%, a difference of 0.10%), Immigrants from Romania (3.0%, a difference of 0.23%), Immigrants from Moldova (3.0%, a difference of 0.28%), and Immigrants from Sweden (3.0%, a difference of 0.34%).
| Demographics | Rating | Rank | Hearing Disability |
| Immigrants | Ukraine | 56.6 /100 | #171 | Average 3.0% |
| Armenians | 56.0 /100 | #172 | Average 3.0% |
| Immigrants | Serbia | 51.1 /100 | #173 | Average 3.0% |
| Indonesians | 50.0 /100 | #174 | Average 3.0% |
| Immigrants | Romania | 48.4 /100 | #175 | Average 3.0% |
| Panamanians | 47.0 /100 | #176 | Average 3.0% |
| Immigrants | Philippines | 46.4 /100 | #177 | Average 3.0% |
| Japanese | 46.0 /100 | #178 | Average 3.0% |
| Immigrants | Moldova | 43.1 /100 | #179 | Average 3.0% |
| Immigrants | Sweden | 42.4 /100 | #180 | Average 3.0% |
| Immigrants | Belgium | 41.5 /100 | #181 | Average 3.0% |
| Immigrants | Italy | 41.1 /100 | #182 | Average 3.0% |
| Bulgarians | 39.7 /100 | #183 | Fair 3.0% |
| Immigrants | Ireland | 37.4 /100 | #184 | Fair 3.0% |
| Immigrants | Southern Europe | 35.3 /100 | #185 | Fair 3.0% |
Demographics Similar to Hungarians by Hearing Disability
In terms of hearing disability, the demographic groups most similar to Hungarians are Croatian (3.4%, a difference of 0.21%), Yuman (3.4%, a difference of 0.23%), Italian (3.4%, a difference of 0.24%), Carpatho Rusyn (3.4%, a difference of 0.66%), and Austrian (3.4%, a difference of 0.77%).
| Demographics | Rating | Rank | Hearing Disability |
| Assyrians/Chaldeans/Syriacs | 0.9 /100 | #244 | Tragic 3.3% |
| Immigrants | Scotland | 0.8 /100 | #245 | Tragic 3.3% |
| Immigrants | England | 0.7 /100 | #246 | Tragic 3.3% |
| Lithuanians | 0.6 /100 | #247 | Tragic 3.4% |
| Austrians | 0.6 /100 | #248 | Tragic 3.4% |
| Italians | 0.4 /100 | #249 | Tragic 3.4% |
| Yuman | 0.4 /100 | #250 | Tragic 3.4% |
| Hungarians | 0.4 /100 | #251 | Tragic 3.4% |
| Croatians | 0.4 /100 | #252 | Tragic 3.4% |
| Carpatho Rusyns | 0.3 /100 | #253 | Tragic 3.4% |
| Slavs | 0.2 /100 | #254 | Tragic 3.4% |
| Poles | 0.2 /100 | #255 | Tragic 3.4% |
| Hmong | 0.2 /100 | #256 | Tragic 3.4% |
| Yaqui | 0.2 /100 | #257 | Tragic 3.4% |
| Northern Europeans | 0.2 /100 | #258 | Tragic 3.4% |