Japanese vs Immigrants from Zaire Hearing Disability
COMPARE
Japanese
Immigrants from Zaire
Hearing Disability
Hearing Disability Comparison
Japanese
Immigrants from Zaire
3.0%
HEARING DISABILITY
46.0/ 100
METRIC RATING
178th/ 347
METRIC RANK
2.9%
HEARING DISABILITY
88.6/ 100
METRIC RATING
123rd/ 347
METRIC RANK
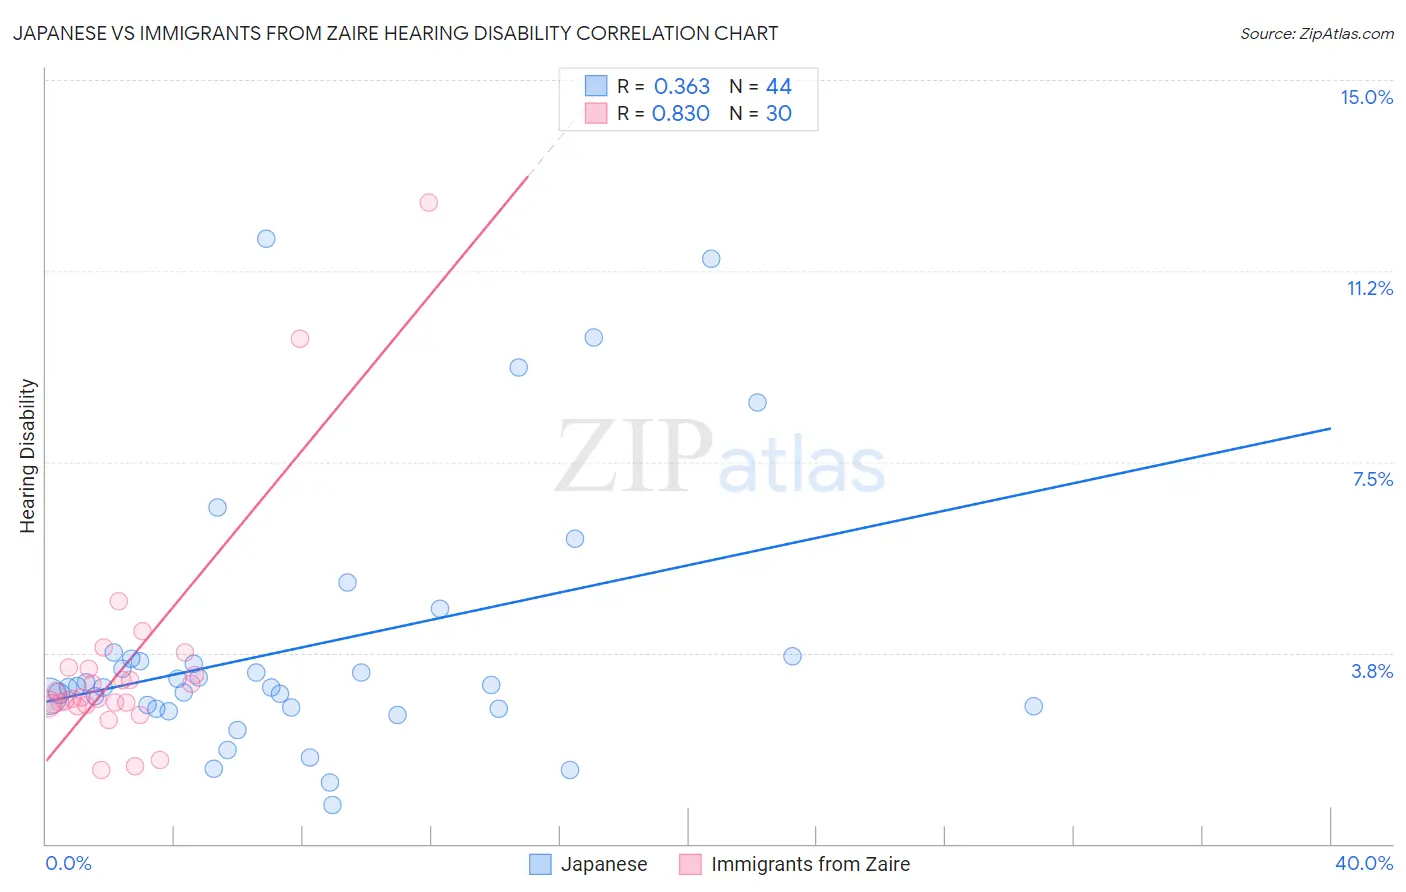
Japanese vs Immigrants from Zaire Hearing Disability Correlation Chart
The statistical analysis conducted on geographies consisting of 249,105,269 people shows a mild positive correlation between the proportion of Japanese and percentage of population with hearing disability in the United States with a correlation coefficient (R) of 0.363 and weighted average of 3.0%. Similarly, the statistical analysis conducted on geographies consisting of 107,252,507 people shows a very strong positive correlation between the proportion of Immigrants from Zaire and percentage of population with hearing disability in the United States with a correlation coefficient (R) of 0.830 and weighted average of 2.9%, a difference of 5.5%.
Hearing Disability Correlation Summary
| Measurement | Japanese | Immigrants from Zaire |
| Minimum | 0.75% | 1.4% |
| Maximum | 11.9% | 12.6% |
| Range | 11.1% | 11.1% |
| Mean | 3.9% | 3.5% |
| Median | 3.1% | 2.9% |
| Interquartile 25% (IQ1) | 2.7% | 2.7% |
| Interquartile 75% (IQ3) | 3.7% | 3.4% |
| Interquartile Range (IQR) | 1.0% | 0.68% |
| Standard Deviation (Sample) | 2.6% | 2.2% |
| Standard Deviation (Population) | 2.6% | 2.2% |
Similar Demographics by Hearing Disability
Demographics Similar to Japanese by Hearing Disability
In terms of hearing disability, the demographic groups most similar to Japanese are Immigrants from Philippines (3.0%, a difference of 0.040%), Panamanian (3.0%, a difference of 0.10%), Immigrants from Romania (3.0%, a difference of 0.23%), Immigrants from Moldova (3.0%, a difference of 0.28%), and Immigrants from Sweden (3.0%, a difference of 0.34%).
| Demographics | Rating | Rank | Hearing Disability |
| Immigrants | Ukraine | 56.6 /100 | #171 | Average 3.0% |
| Armenians | 56.0 /100 | #172 | Average 3.0% |
| Immigrants | Serbia | 51.1 /100 | #173 | Average 3.0% |
| Indonesians | 50.0 /100 | #174 | Average 3.0% |
| Immigrants | Romania | 48.4 /100 | #175 | Average 3.0% |
| Panamanians | 47.0 /100 | #176 | Average 3.0% |
| Immigrants | Philippines | 46.4 /100 | #177 | Average 3.0% |
| Japanese | 46.0 /100 | #178 | Average 3.0% |
| Immigrants | Moldova | 43.1 /100 | #179 | Average 3.0% |
| Immigrants | Sweden | 42.4 /100 | #180 | Average 3.0% |
| Immigrants | Belgium | 41.5 /100 | #181 | Average 3.0% |
| Immigrants | Italy | 41.1 /100 | #182 | Average 3.0% |
| Bulgarians | 39.7 /100 | #183 | Fair 3.0% |
| Immigrants | Ireland | 37.4 /100 | #184 | Fair 3.0% |
| Immigrants | Southern Europe | 35.3 /100 | #185 | Fair 3.0% |
Demographics Similar to Immigrants from Zaire by Hearing Disability
In terms of hearing disability, the demographic groups most similar to Immigrants from Zaire are Bahamian (2.9%, a difference of 0.010%), Immigrants from Albania (2.9%, a difference of 0.030%), Liberian (2.8%, a difference of 0.090%), Cuban (2.8%, a difference of 0.18%), and Immigrants from Sudan (2.9%, a difference of 0.19%).
| Demographics | Rating | Rank | Hearing Disability |
| Immigrants | Immigrants | 90.3 /100 | #116 | Exceptional 2.8% |
| Immigrants | Liberia | 90.0 /100 | #117 | Excellent 2.8% |
| Zimbabweans | 89.9 /100 | #118 | Excellent 2.8% |
| Kenyans | 89.8 /100 | #119 | Excellent 2.8% |
| Jordanians | 89.5 /100 | #120 | Excellent 2.8% |
| Cubans | 89.4 /100 | #121 | Excellent 2.8% |
| Liberians | 89.0 /100 | #122 | Excellent 2.8% |
| Immigrants | Zaire | 88.6 /100 | #123 | Excellent 2.9% |
| Bahamians | 88.6 /100 | #124 | Excellent 2.9% |
| Immigrants | Albania | 88.5 /100 | #125 | Excellent 2.9% |
| Immigrants | Sudan | 87.8 /100 | #126 | Excellent 2.9% |
| South American Indians | 86.9 /100 | #127 | Excellent 2.9% |
| Immigrants | Western Asia | 86.9 /100 | #128 | Excellent 2.9% |
| Immigrants | Uganda | 86.6 /100 | #129 | Excellent 2.9% |
| Immigrants | Vietnam | 86.5 /100 | #130 | Excellent 2.9% |