Israeli vs Houma Disability Age Over 75
COMPARE
Israeli
Houma
Disability Age Over 75
Disability Age Over 75 Comparison
Israelis
Houma
46.4%
DISABILITY AGE OVER 75
97.0/ 100
METRIC RATING
104th/ 347
METRIC RANK
56.2%
DISABILITY AGE OVER 75
0.0/ 100
METRIC RATING
341st/ 347
METRIC RANK
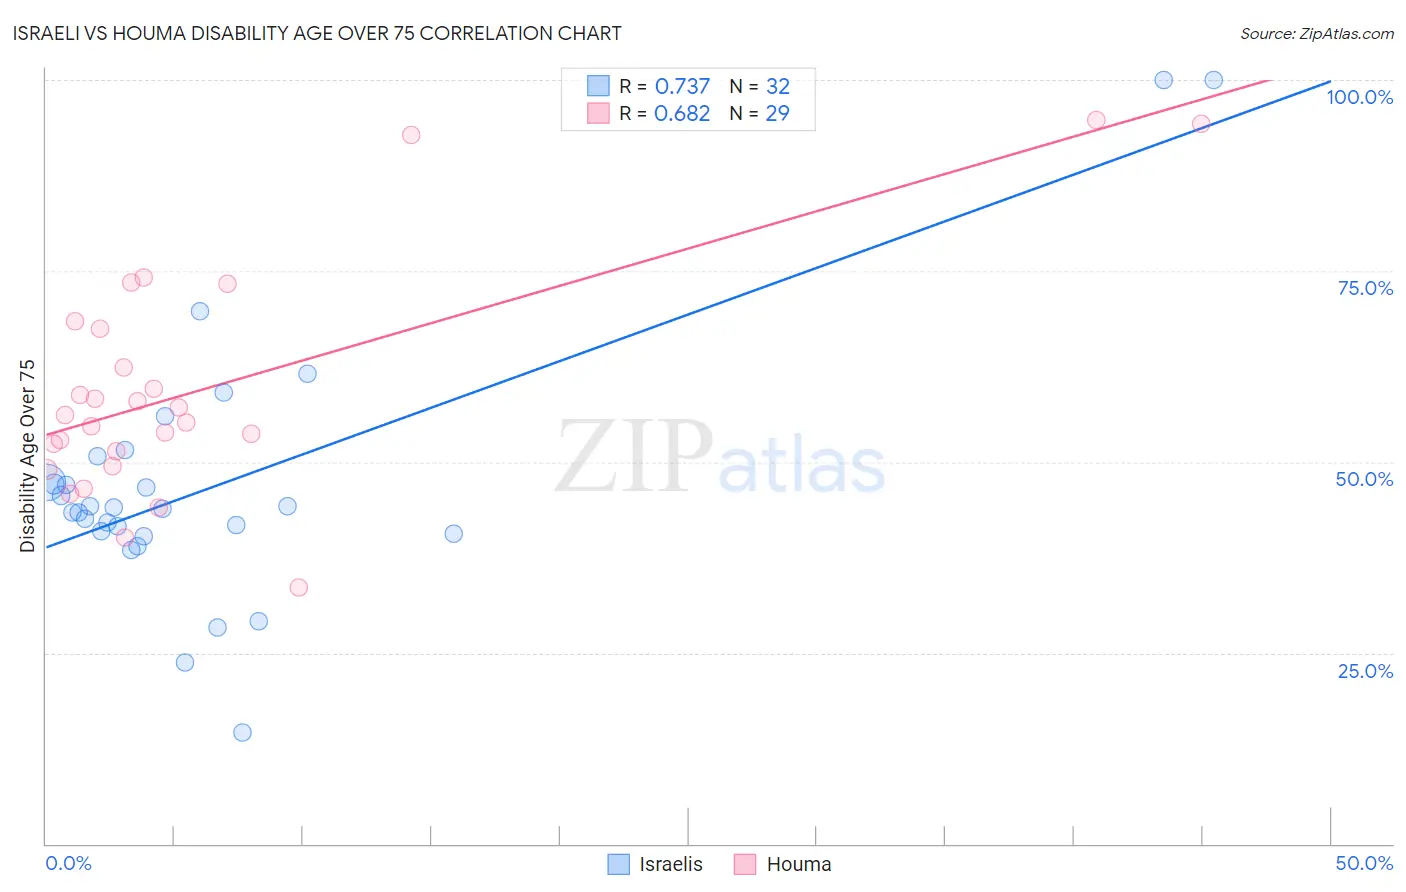
Israeli vs Houma Disability Age Over 75 Correlation Chart
The statistical analysis conducted on geographies consisting of 210,857,618 people shows a strong positive correlation between the proportion of Israelis and percentage of population with a disability over the age of 75 in the United States with a correlation coefficient (R) of 0.737 and weighted average of 46.4%. Similarly, the statistical analysis conducted on geographies consisting of 36,766,477 people shows a significant positive correlation between the proportion of Houma and percentage of population with a disability over the age of 75 in the United States with a correlation coefficient (R) of 0.682 and weighted average of 56.2%, a difference of 21.0%.
Disability Age Over 75 Correlation Summary
| Measurement | Israeli | Houma |
| Minimum | 14.6% | 33.5% |
| Maximum | 100.0% | 94.7% |
| Range | 85.4% | 61.3% |
| Mean | 47.1% | 59.7% |
| Median | 44.0% | 56.1% |
| Interquartile 25% (IQ1) | 40.7% | 50.4% |
| Interquartile 75% (IQ3) | 49.0% | 67.9% |
| Interquartile Range (IQR) | 8.3% | 17.5% |
| Standard Deviation (Sample) | 17.3% | 15.2% |
| Standard Deviation (Population) | 17.0% | 14.9% |
Similar Demographics by Disability Age Over 75
Demographics Similar to Israelis by Disability Age Over 75
In terms of disability age over 75, the demographic groups most similar to Israelis are Immigrants from Malaysia (46.4%, a difference of 0.020%), Ukrainian (46.4%, a difference of 0.020%), Immigrants from Cameroon (46.4%, a difference of 0.020%), Immigrants from Kuwait (46.4%, a difference of 0.040%), and Immigrants from Uruguay (46.4%, a difference of 0.070%).
| Demographics | Rating | Rank | Disability Age Over 75 |
| Finns | 97.9 /100 | #97 | Exceptional 46.3% |
| Immigrants | Japan | 97.8 /100 | #98 | Exceptional 46.3% |
| Palestinians | 97.7 /100 | #99 | Exceptional 46.3% |
| Immigrants | Eastern Europe | 97.7 /100 | #100 | Exceptional 46.3% |
| Mongolians | 97.7 /100 | #101 | Exceptional 46.3% |
| Immigrants | Malaysia | 97.1 /100 | #102 | Exceptional 46.4% |
| Ukrainians | 97.1 /100 | #103 | Exceptional 46.4% |
| Israelis | 97.0 /100 | #104 | Exceptional 46.4% |
| Immigrants | Cameroon | 96.9 /100 | #105 | Exceptional 46.4% |
| Immigrants | Kuwait | 96.8 /100 | #106 | Exceptional 46.4% |
| Immigrants | Uruguay | 96.7 /100 | #107 | Exceptional 46.4% |
| Brazilians | 96.6 /100 | #108 | Exceptional 46.5% |
| Chileans | 96.4 /100 | #109 | Exceptional 46.5% |
| Immigrants | Hong Kong | 96.4 /100 | #110 | Exceptional 46.5% |
| Immigrants | Chile | 96.4 /100 | #111 | Exceptional 46.5% |
Demographics Similar to Houma by Disability Age Over 75
In terms of disability age over 75, the demographic groups most similar to Houma are Lumbee (56.2%, a difference of 0.16%), Pueblo (55.9%, a difference of 0.51%), Pima (55.8%, a difference of 0.59%), Tohono O'odham (56.7%, a difference of 1.0%), and Colville (55.4%, a difference of 1.4%).
| Demographics | Rating | Rank | Disability Age Over 75 |
| Apache | 0.0 /100 | #333 | Tragic 53.6% |
| Alaskan Athabascans | 0.0 /100 | #334 | Tragic 54.0% |
| Kiowa | 0.0 /100 | #335 | Tragic 54.2% |
| Immigrants | Armenia | 0.0 /100 | #336 | Tragic 54.3% |
| Yuman | 0.0 /100 | #337 | Tragic 54.4% |
| Colville | 0.0 /100 | #338 | Tragic 55.4% |
| Pima | 0.0 /100 | #339 | Tragic 55.8% |
| Pueblo | 0.0 /100 | #340 | Tragic 55.9% |
| Houma | 0.0 /100 | #341 | Tragic 56.2% |
| Lumbee | 0.0 /100 | #342 | Tragic 56.2% |
| Tohono O'odham | 0.0 /100 | #343 | Tragic 56.7% |
| Navajo | 0.0 /100 | #344 | Tragic 58.3% |
| Inupiat | 0.0 /100 | #345 | Tragic 58.4% |
| Tsimshian | 0.0 /100 | #346 | Tragic 59.2% |
| Yup'ik | 0.0 /100 | #347 | Tragic 61.1% |