Immigrants from North America vs Houma Disability Age Over 75
COMPARE
Immigrants from North America
Houma
Disability Age Over 75
Disability Age Over 75 Comparison
Immigrants from North America
Houma
45.7%
DISABILITY AGE OVER 75
99.8/ 100
METRIC RATING
49th/ 347
METRIC RANK
56.2%
DISABILITY AGE OVER 75
0.0/ 100
METRIC RATING
341st/ 347
METRIC RANK
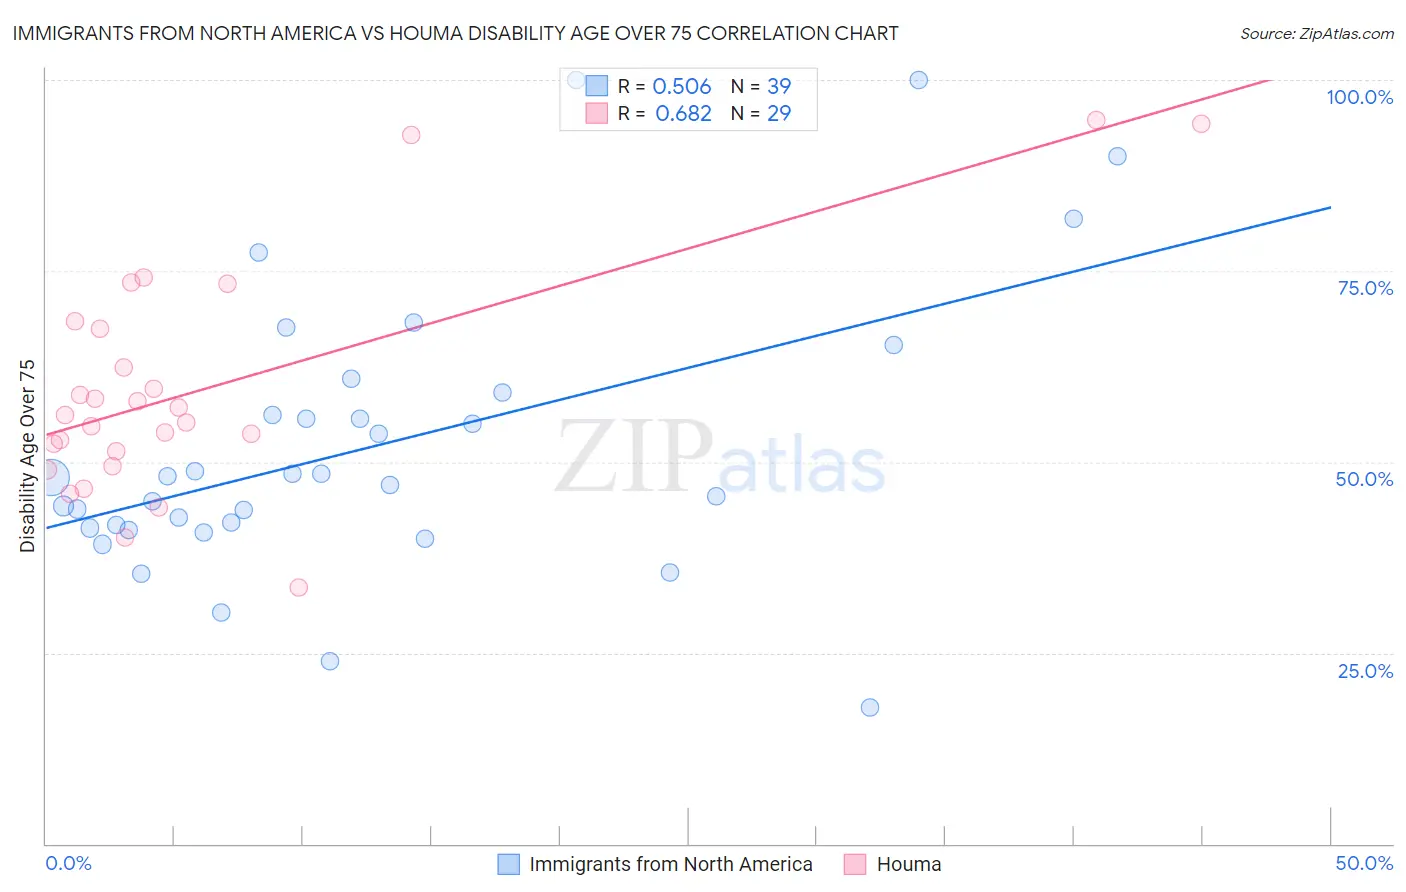
Immigrants from North America vs Houma Disability Age Over 75 Correlation Chart
The statistical analysis conducted on geographies consisting of 461,705,283 people shows a substantial positive correlation between the proportion of Immigrants from North America and percentage of population with a disability over the age of 75 in the United States with a correlation coefficient (R) of 0.506 and weighted average of 45.7%. Similarly, the statistical analysis conducted on geographies consisting of 36,766,477 people shows a significant positive correlation between the proportion of Houma and percentage of population with a disability over the age of 75 in the United States with a correlation coefficient (R) of 0.682 and weighted average of 56.2%, a difference of 22.8%.
Disability Age Over 75 Correlation Summary
| Measurement | Immigrants from North America | Houma |
| Minimum | 17.9% | 33.5% |
| Maximum | 100.0% | 94.7% |
| Range | 82.1% | 61.3% |
| Mean | 52.0% | 59.7% |
| Median | 48.0% | 56.1% |
| Interquartile 25% (IQ1) | 41.4% | 50.4% |
| Interquartile 75% (IQ3) | 59.1% | 67.9% |
| Interquartile Range (IQR) | 17.8% | 17.5% |
| Standard Deviation (Sample) | 18.3% | 15.2% |
| Standard Deviation (Population) | 18.1% | 14.9% |
Similar Demographics by Disability Age Over 75
Demographics Similar to Immigrants from North America by Disability Age Over 75
In terms of disability age over 75, the demographic groups most similar to Immigrants from North America are Immigrants from Canada (45.7%, a difference of 0.070%), Croatian (45.7%, a difference of 0.070%), Swedish (45.7%, a difference of 0.090%), Australian (45.7%, a difference of 0.12%), and Turkish (45.7%, a difference of 0.12%).
| Demographics | Rating | Rank | Disability Age Over 75 |
| Greeks | 99.8 /100 | #42 | Exceptional 45.6% |
| Czechs | 99.8 /100 | #43 | Exceptional 45.7% |
| Australians | 99.8 /100 | #44 | Exceptional 45.7% |
| Turks | 99.8 /100 | #45 | Exceptional 45.7% |
| Swedes | 99.8 /100 | #46 | Exceptional 45.7% |
| Immigrants | Canada | 99.8 /100 | #47 | Exceptional 45.7% |
| Croatians | 99.8 /100 | #48 | Exceptional 45.7% |
| Immigrants | North America | 99.8 /100 | #49 | Exceptional 45.7% |
| Belgians | 99.7 /100 | #50 | Exceptional 45.8% |
| Immigrants | Korea | 99.7 /100 | #51 | Exceptional 45.8% |
| Immigrants | France | 99.7 /100 | #52 | Exceptional 45.8% |
| Immigrants | Italy | 99.7 /100 | #53 | Exceptional 45.8% |
| Slovaks | 99.6 /100 | #54 | Exceptional 45.8% |
| Maltese | 99.6 /100 | #55 | Exceptional 45.8% |
| Immigrants | Netherlands | 99.6 /100 | #56 | Exceptional 45.9% |
Demographics Similar to Houma by Disability Age Over 75
In terms of disability age over 75, the demographic groups most similar to Houma are Lumbee (56.2%, a difference of 0.16%), Pueblo (55.9%, a difference of 0.51%), Pima (55.8%, a difference of 0.59%), Tohono O'odham (56.7%, a difference of 1.0%), and Colville (55.4%, a difference of 1.4%).
| Demographics | Rating | Rank | Disability Age Over 75 |
| Apache | 0.0 /100 | #333 | Tragic 53.6% |
| Alaskan Athabascans | 0.0 /100 | #334 | Tragic 54.0% |
| Kiowa | 0.0 /100 | #335 | Tragic 54.2% |
| Immigrants | Armenia | 0.0 /100 | #336 | Tragic 54.3% |
| Yuman | 0.0 /100 | #337 | Tragic 54.4% |
| Colville | 0.0 /100 | #338 | Tragic 55.4% |
| Pima | 0.0 /100 | #339 | Tragic 55.8% |
| Pueblo | 0.0 /100 | #340 | Tragic 55.9% |
| Houma | 0.0 /100 | #341 | Tragic 56.2% |
| Lumbee | 0.0 /100 | #342 | Tragic 56.2% |
| Tohono O'odham | 0.0 /100 | #343 | Tragic 56.7% |
| Navajo | 0.0 /100 | #344 | Tragic 58.3% |
| Inupiat | 0.0 /100 | #345 | Tragic 58.4% |
| Tsimshian | 0.0 /100 | #346 | Tragic 59.2% |
| Yup'ik | 0.0 /100 | #347 | Tragic 61.1% |