Israeli vs Immigrants from South America Disability Age Over 75
COMPARE
Israeli
Immigrants from South America
Disability Age Over 75
Disability Age Over 75 Comparison
Israelis
Immigrants from South America
46.4%
DISABILITY AGE OVER 75
97.0/ 100
METRIC RATING
104th/ 347
METRIC RANK
46.7%
DISABILITY AGE OVER 75
91.8/ 100
METRIC RATING
124th/ 347
METRIC RANK
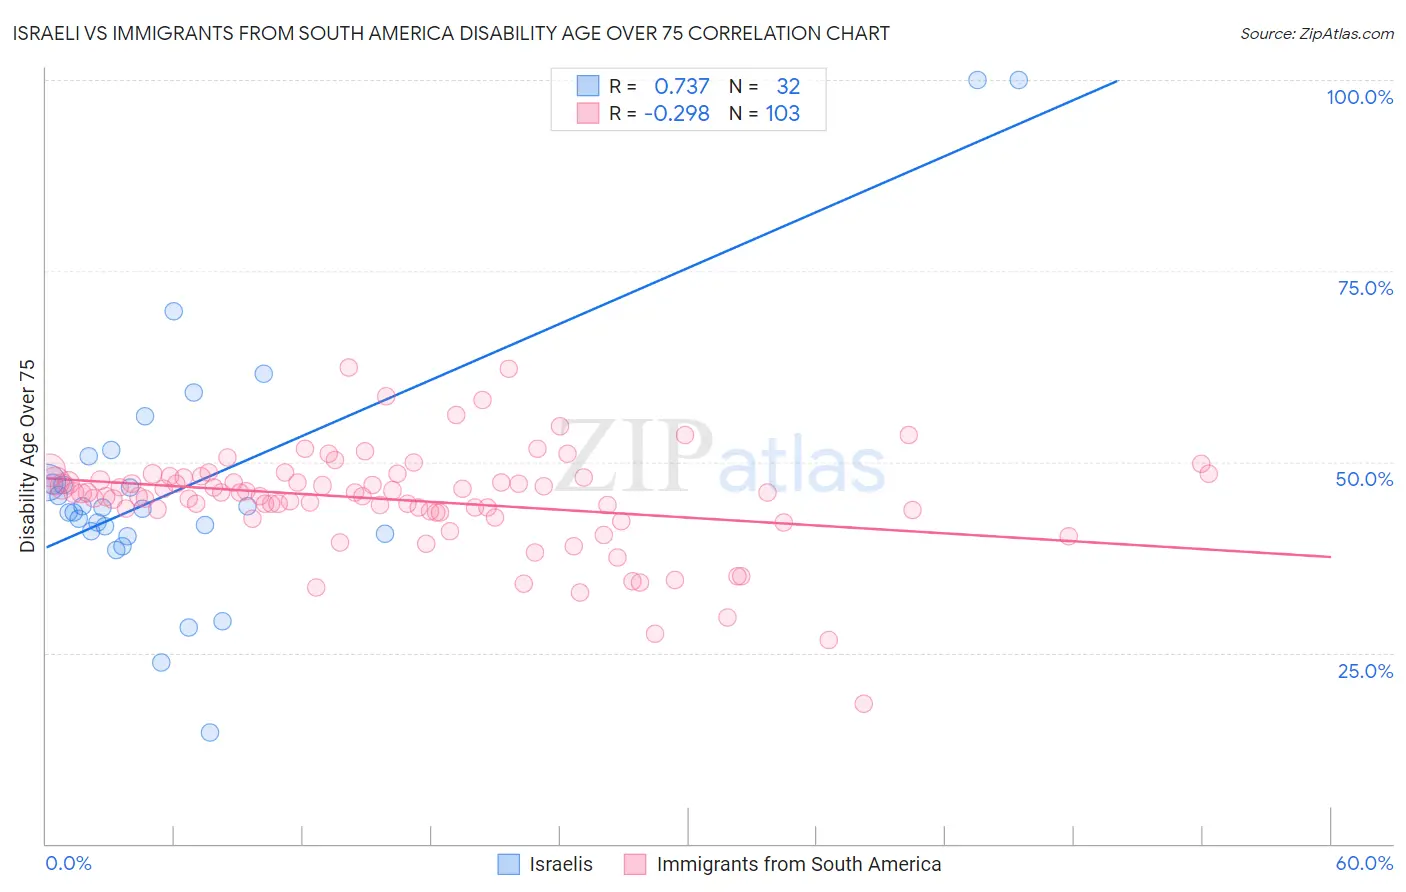
Israeli vs Immigrants from South America Disability Age Over 75 Correlation Chart
The statistical analysis conducted on geographies consisting of 210,857,618 people shows a strong positive correlation between the proportion of Israelis and percentage of population with a disability over the age of 75 in the United States with a correlation coefficient (R) of 0.737 and weighted average of 46.4%. Similarly, the statistical analysis conducted on geographies consisting of 485,170,882 people shows a weak negative correlation between the proportion of Immigrants from South America and percentage of population with a disability over the age of 75 in the United States with a correlation coefficient (R) of -0.298 and weighted average of 46.7%, a difference of 0.62%.
Disability Age Over 75 Correlation Summary
| Measurement | Israeli | Immigrants from South America |
| Minimum | 14.6% | 18.4% |
| Maximum | 100.0% | 62.4% |
| Range | 85.4% | 44.0% |
| Mean | 47.1% | 45.0% |
| Median | 44.0% | 45.9% |
| Interquartile 25% (IQ1) | 40.7% | 43.4% |
| Interquartile 75% (IQ3) | 49.0% | 48.0% |
| Interquartile Range (IQR) | 8.3% | 4.6% |
| Standard Deviation (Sample) | 17.3% | 6.8% |
| Standard Deviation (Population) | 17.0% | 6.7% |
Demographics Similar to Israelis and Immigrants from South America by Disability Age Over 75
In terms of disability age over 75, the demographic groups most similar to Israelis are Immigrants from Cameroon (46.4%, a difference of 0.020%), Immigrants from Kuwait (46.4%, a difference of 0.040%), Immigrants from Uruguay (46.4%, a difference of 0.070%), Brazilian (46.5%, a difference of 0.080%), and Chilean (46.5%, a difference of 0.11%). Similarly, the demographic groups most similar to Immigrants from South America are Immigrants from Colombia (46.7%, a difference of 0.060%), Immigrants from Albania (46.6%, a difference of 0.11%), Scandinavian (46.6%, a difference of 0.16%), Immigrants from Nepal (46.6%, a difference of 0.20%), and Canadian (46.6%, a difference of 0.24%).
| Demographics | Rating | Rank | Disability Age Over 75 |
| Israelis | 97.0 /100 | #104 | Exceptional 46.4% |
| Immigrants | Cameroon | 96.9 /100 | #105 | Exceptional 46.4% |
| Immigrants | Kuwait | 96.8 /100 | #106 | Exceptional 46.4% |
| Immigrants | Uruguay | 96.7 /100 | #107 | Exceptional 46.4% |
| Brazilians | 96.6 /100 | #108 | Exceptional 46.5% |
| Chileans | 96.4 /100 | #109 | Exceptional 46.5% |
| Immigrants | Hong Kong | 96.4 /100 | #110 | Exceptional 46.5% |
| Immigrants | Chile | 96.4 /100 | #111 | Exceptional 46.5% |
| Immigrants | Pakistan | 96.1 /100 | #112 | Exceptional 46.5% |
| Irish | 96.0 /100 | #113 | Exceptional 46.5% |
| Dutch | 95.9 /100 | #114 | Exceptional 46.5% |
| British | 95.7 /100 | #115 | Exceptional 46.5% |
| Indians (Asian) | 95.7 /100 | #116 | Exceptional 46.5% |
| Hungarians | 95.3 /100 | #117 | Exceptional 46.5% |
| Czechoslovakians | 94.7 /100 | #118 | Exceptional 46.6% |
| Canadians | 94.4 /100 | #119 | Exceptional 46.6% |
| Immigrants | Nepal | 94.1 /100 | #120 | Exceptional 46.6% |
| Scandinavians | 93.6 /100 | #121 | Exceptional 46.6% |
| Immigrants | Albania | 93.2 /100 | #122 | Exceptional 46.6% |
| Immigrants | Colombia | 92.6 /100 | #123 | Exceptional 46.7% |
| Immigrants | South America | 91.8 /100 | #124 | Exceptional 46.7% |