Immigrants from Afghanistan vs Houma Disability Age Over 75
COMPARE
Immigrants from Afghanistan
Houma
Disability Age Over 75
Disability Age Over 75 Comparison
Immigrants from Afghanistan
Houma
48.8%
DISABILITY AGE OVER 75
0.4/ 100
METRIC RATING
260th/ 347
METRIC RANK
56.2%
DISABILITY AGE OVER 75
0.0/ 100
METRIC RATING
341st/ 347
METRIC RANK
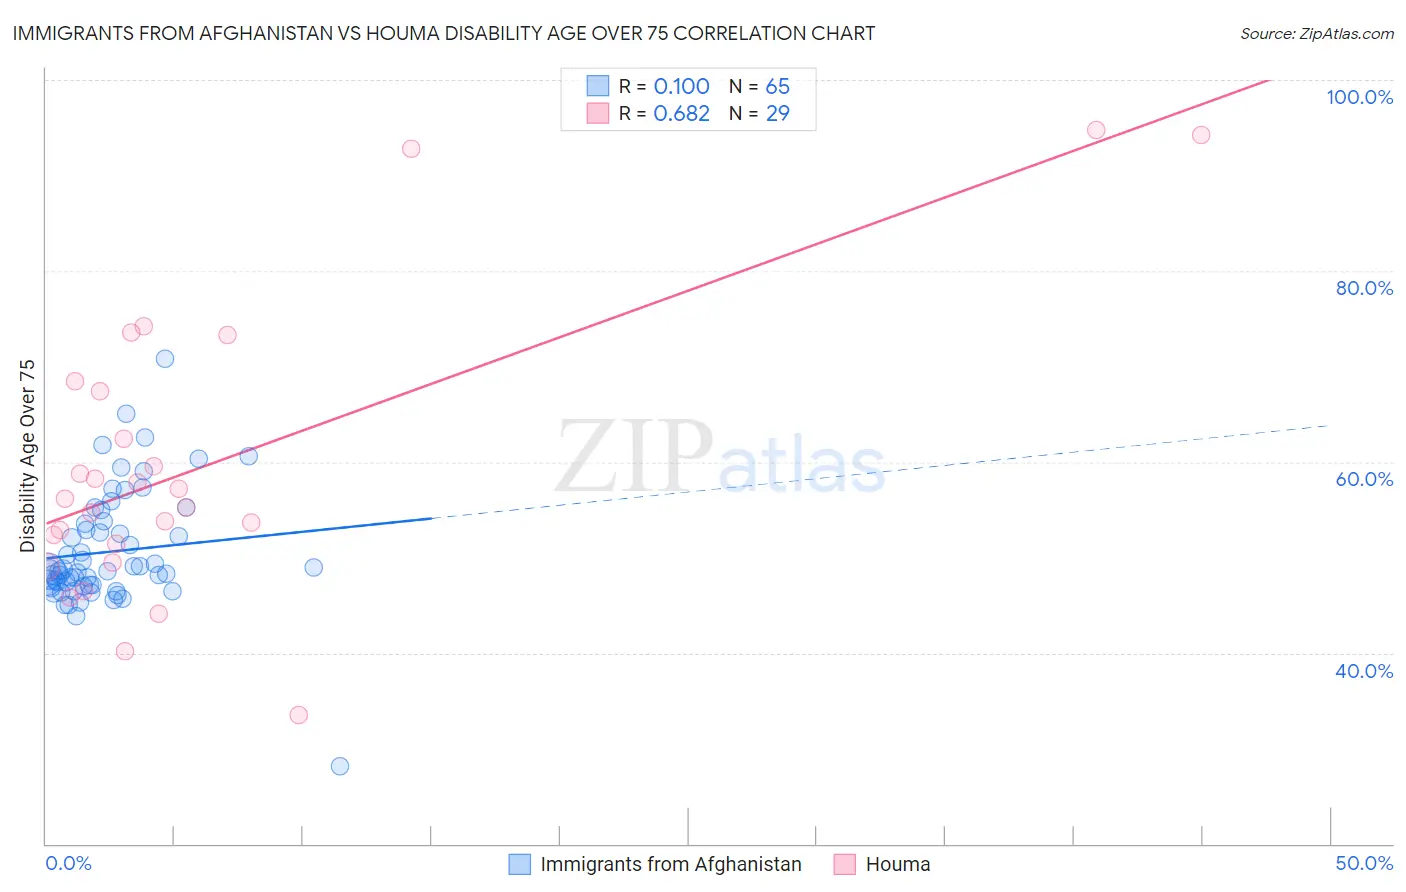
Immigrants from Afghanistan vs Houma Disability Age Over 75 Correlation Chart
The statistical analysis conducted on geographies consisting of 147,547,224 people shows a poor positive correlation between the proportion of Immigrants from Afghanistan and percentage of population with a disability over the age of 75 in the United States with a correlation coefficient (R) of 0.100 and weighted average of 48.8%. Similarly, the statistical analysis conducted on geographies consisting of 36,766,477 people shows a significant positive correlation between the proportion of Houma and percentage of population with a disability over the age of 75 in the United States with a correlation coefficient (R) of 0.682 and weighted average of 56.2%, a difference of 15.0%.
Disability Age Over 75 Correlation Summary
| Measurement | Immigrants from Afghanistan | Houma |
| Minimum | 28.2% | 33.5% |
| Maximum | 70.8% | 94.7% |
| Range | 42.6% | 61.3% |
| Mean | 50.6% | 59.7% |
| Median | 48.6% | 56.1% |
| Interquartile 25% (IQ1) | 47.1% | 50.4% |
| Interquartile 75% (IQ3) | 53.7% | 67.9% |
| Interquartile Range (IQR) | 6.6% | 17.5% |
| Standard Deviation (Sample) | 6.2% | 15.2% |
| Standard Deviation (Population) | 6.2% | 14.9% |
Similar Demographics by Disability Age Over 75
Demographics Similar to Immigrants from Afghanistan by Disability Age Over 75
In terms of disability age over 75, the demographic groups most similar to Immigrants from Afghanistan are Central American (48.8%, a difference of 0.040%), African (48.9%, a difference of 0.060%), Immigrants from Philippines (48.8%, a difference of 0.11%), Immigrants from West Indies (48.9%, a difference of 0.12%), and Salvadoran (48.9%, a difference of 0.13%).
| Demographics | Rating | Rank | Disability Age Over 75 |
| British West Indians | 0.6 /100 | #253 | Tragic 48.7% |
| Immigrants | Vietnam | 0.6 /100 | #254 | Tragic 48.7% |
| Chinese | 0.5 /100 | #255 | Tragic 48.7% |
| Immigrants | Congo | 0.5 /100 | #256 | Tragic 48.7% |
| Blackfeet | 0.5 /100 | #257 | Tragic 48.8% |
| Immigrants | Philippines | 0.4 /100 | #258 | Tragic 48.8% |
| Central Americans | 0.4 /100 | #259 | Tragic 48.8% |
| Immigrants | Afghanistan | 0.4 /100 | #260 | Tragic 48.8% |
| Africans | 0.3 /100 | #261 | Tragic 48.9% |
| Immigrants | West Indies | 0.3 /100 | #262 | Tragic 48.9% |
| Salvadorans | 0.3 /100 | #263 | Tragic 48.9% |
| Immigrants | Honduras | 0.3 /100 | #264 | Tragic 48.9% |
| Hondurans | 0.3 /100 | #265 | Tragic 48.9% |
| U.S. Virgin Islanders | 0.2 /100 | #266 | Tragic 48.9% |
| Malaysians | 0.2 /100 | #267 | Tragic 49.0% |
Demographics Similar to Houma by Disability Age Over 75
In terms of disability age over 75, the demographic groups most similar to Houma are Lumbee (56.2%, a difference of 0.16%), Pueblo (55.9%, a difference of 0.51%), Pima (55.8%, a difference of 0.59%), Tohono O'odham (56.7%, a difference of 1.0%), and Colville (55.4%, a difference of 1.4%).
| Demographics | Rating | Rank | Disability Age Over 75 |
| Apache | 0.0 /100 | #333 | Tragic 53.6% |
| Alaskan Athabascans | 0.0 /100 | #334 | Tragic 54.0% |
| Kiowa | 0.0 /100 | #335 | Tragic 54.2% |
| Immigrants | Armenia | 0.0 /100 | #336 | Tragic 54.3% |
| Yuman | 0.0 /100 | #337 | Tragic 54.4% |
| Colville | 0.0 /100 | #338 | Tragic 55.4% |
| Pima | 0.0 /100 | #339 | Tragic 55.8% |
| Pueblo | 0.0 /100 | #340 | Tragic 55.9% |
| Houma | 0.0 /100 | #341 | Tragic 56.2% |
| Lumbee | 0.0 /100 | #342 | Tragic 56.2% |
| Tohono O'odham | 0.0 /100 | #343 | Tragic 56.7% |
| Navajo | 0.0 /100 | #344 | Tragic 58.3% |
| Inupiat | 0.0 /100 | #345 | Tragic 58.4% |
| Tsimshian | 0.0 /100 | #346 | Tragic 59.2% |
| Yup'ik | 0.0 /100 | #347 | Tragic 61.1% |