Iroquois vs Immigrants from Barbados Disability Age 35 to 64
COMPARE
Iroquois
Immigrants from Barbados
Disability Age 35 to 64
Disability Age 35 to 64 Comparison
Iroquois
Immigrants from Barbados
14.4%
DISABILITY AGE 35 TO 64
0.0/ 100
METRIC RATING
313th/ 347
METRIC RANK
11.3%
DISABILITY AGE 35 TO 64
41.6/ 100
METRIC RATING
179th/ 347
METRIC RANK
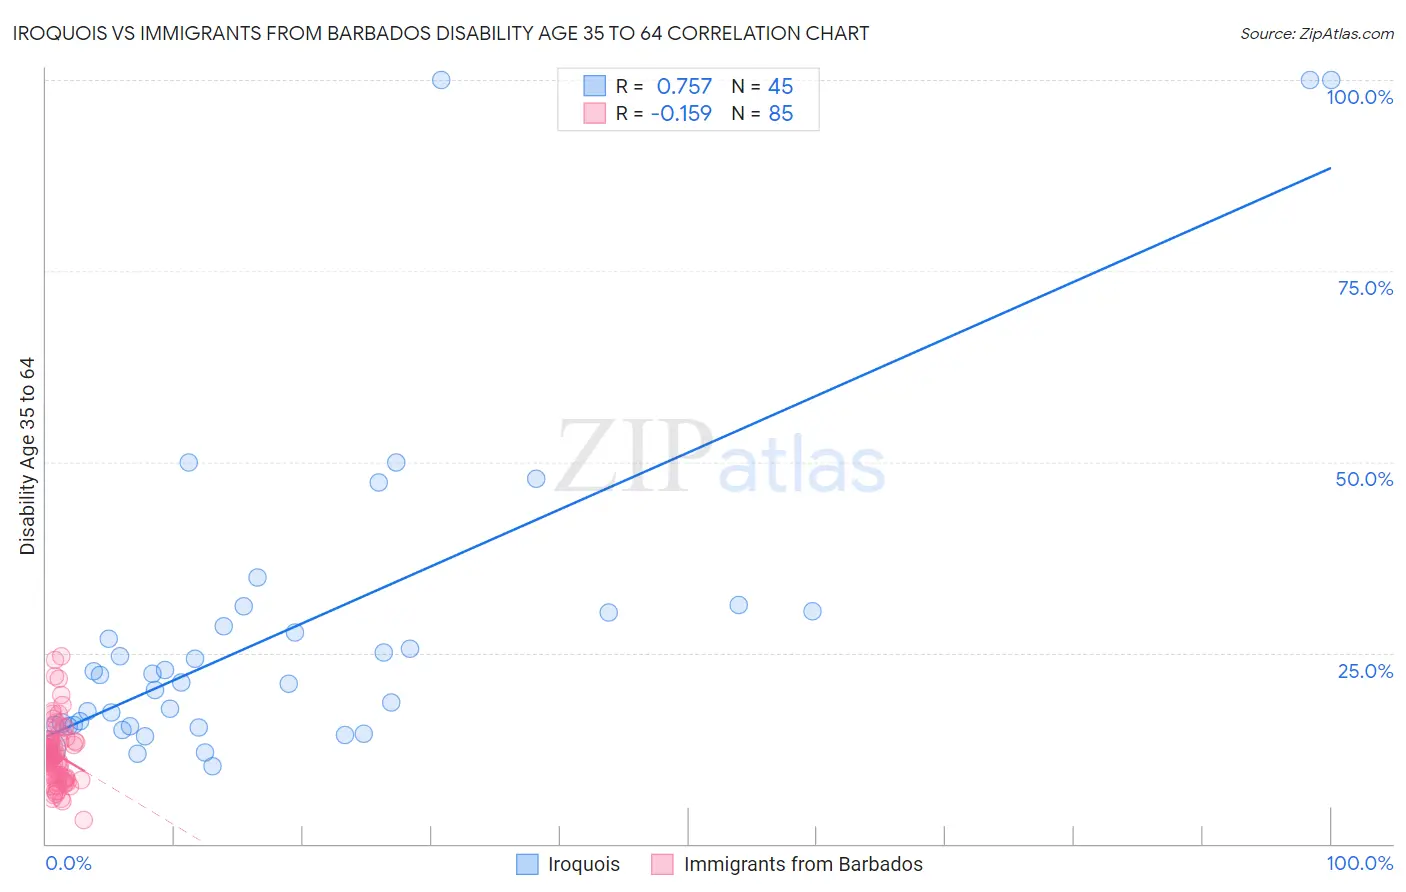
Iroquois vs Immigrants from Barbados Disability Age 35 to 64 Correlation Chart
The statistical analysis conducted on geographies consisting of 207,235,793 people shows a strong positive correlation between the proportion of Iroquois and percentage of population with a disability between the ages 34 and 64 in the United States with a correlation coefficient (R) of 0.757 and weighted average of 14.4%. Similarly, the statistical analysis conducted on geographies consisting of 112,766,273 people shows a poor negative correlation between the proportion of Immigrants from Barbados and percentage of population with a disability between the ages 34 and 64 in the United States with a correlation coefficient (R) of -0.159 and weighted average of 11.3%, a difference of 26.5%.
Disability Age 35 to 64 Correlation Summary
| Measurement | Iroquois | Immigrants from Barbados |
| Minimum | 10.2% | 3.0% |
| Maximum | 100.0% | 24.6% |
| Range | 89.8% | 21.5% |
| Mean | 28.2% | 11.7% |
| Median | 22.1% | 11.5% |
| Interquartile 25% (IQ1) | 15.5% | 8.7% |
| Interquartile 75% (IQ3) | 30.4% | 13.3% |
| Interquartile Range (IQR) | 14.9% | 4.5% |
| Standard Deviation (Sample) | 21.9% | 4.0% |
| Standard Deviation (Population) | 21.6% | 4.0% |
Similar Demographics by Disability Age 35 to 64
Demographics Similar to Iroquois by Disability Age 35 to 64
In terms of disability age 35 to 64, the demographic groups most similar to Iroquois are Paiute (14.3%, a difference of 0.44%), Immigrants from the Azores (14.3%, a difference of 0.58%), Shoshone (14.5%, a difference of 0.76%), Alaska Native (14.5%, a difference of 0.77%), and Osage (14.5%, a difference of 0.97%).
| Demographics | Rating | Rank | Disability Age 35 to 64 |
| Immigrants | Yemen | 0.0 /100 | #306 | Tragic 14.0% |
| Blackfeet | 0.0 /100 | #307 | Tragic 14.1% |
| Inupiat | 0.0 /100 | #308 | Tragic 14.1% |
| Cree | 0.0 /100 | #309 | Tragic 14.1% |
| Cape Verdeans | 0.0 /100 | #310 | Tragic 14.1% |
| Immigrants | Azores | 0.0 /100 | #311 | Tragic 14.3% |
| Paiute | 0.0 /100 | #312 | Tragic 14.3% |
| Iroquois | 0.0 /100 | #313 | Tragic 14.4% |
| Shoshone | 0.0 /100 | #314 | Tragic 14.5% |
| Alaska Natives | 0.0 /100 | #315 | Tragic 14.5% |
| Osage | 0.0 /100 | #316 | Tragic 14.5% |
| Crow | 0.0 /100 | #317 | Tragic 14.6% |
| Ottawa | 0.0 /100 | #318 | Tragic 14.6% |
| Immigrants | Cabo Verde | 0.0 /100 | #319 | Tragic 14.7% |
| Blacks/African Americans | 0.0 /100 | #320 | Tragic 14.7% |
Demographics Similar to Immigrants from Barbados by Disability Age 35 to 64
In terms of disability age 35 to 64, the demographic groups most similar to Immigrants from Barbados are Immigrants from Caribbean (11.3%, a difference of 0.0%), Polish (11.3%, a difference of 0.040%), Immigrants from Eastern Africa (11.3%, a difference of 0.060%), Trinidadian and Tobagonian (11.4%, a difference of 0.070%), and Icelander (11.4%, a difference of 0.15%).
| Demographics | Rating | Rank | Disability Age 35 to 64 |
| Italians | 55.6 /100 | #172 | Average 11.2% |
| Lebanese | 51.8 /100 | #173 | Average 11.3% |
| Immigrants | Fiji | 50.0 /100 | #174 | Average 11.3% |
| Czechs | 47.9 /100 | #175 | Average 11.3% |
| Ugandans | 43.7 /100 | #176 | Average 11.3% |
| Immigrants | Eastern Africa | 42.2 /100 | #177 | Average 11.3% |
| Poles | 42.0 /100 | #178 | Average 11.3% |
| Immigrants | Barbados | 41.6 /100 | #179 | Average 11.3% |
| Immigrants | Caribbean | 41.5 /100 | #180 | Average 11.3% |
| Trinidadians and Tobagonians | 40.8 /100 | #181 | Average 11.4% |
| Icelanders | 39.7 /100 | #182 | Fair 11.4% |
| Immigrants | Oceania | 39.5 /100 | #183 | Fair 11.4% |
| Kenyans | 39.2 /100 | #184 | Fair 11.4% |
| Danes | 36.8 /100 | #185 | Fair 11.4% |
| Slovenes | 36.6 /100 | #186 | Fair 11.4% |