Iroquois vs Immigrants from Cambodia Family Households with Children
COMPARE
Iroquois
Immigrants from Cambodia
Family Households with Children
Family Households with Children Comparison
Iroquois
Immigrants from Cambodia
26.1%
FAMILY HOUSEHOLDS WITH CHILDREN
0.0/ 100
METRIC RATING
318th/ 347
METRIC RANK
28.9%
FAMILY HOUSEHOLDS WITH CHILDREN
100.0/ 100
METRIC RATING
53rd/ 347
METRIC RANK
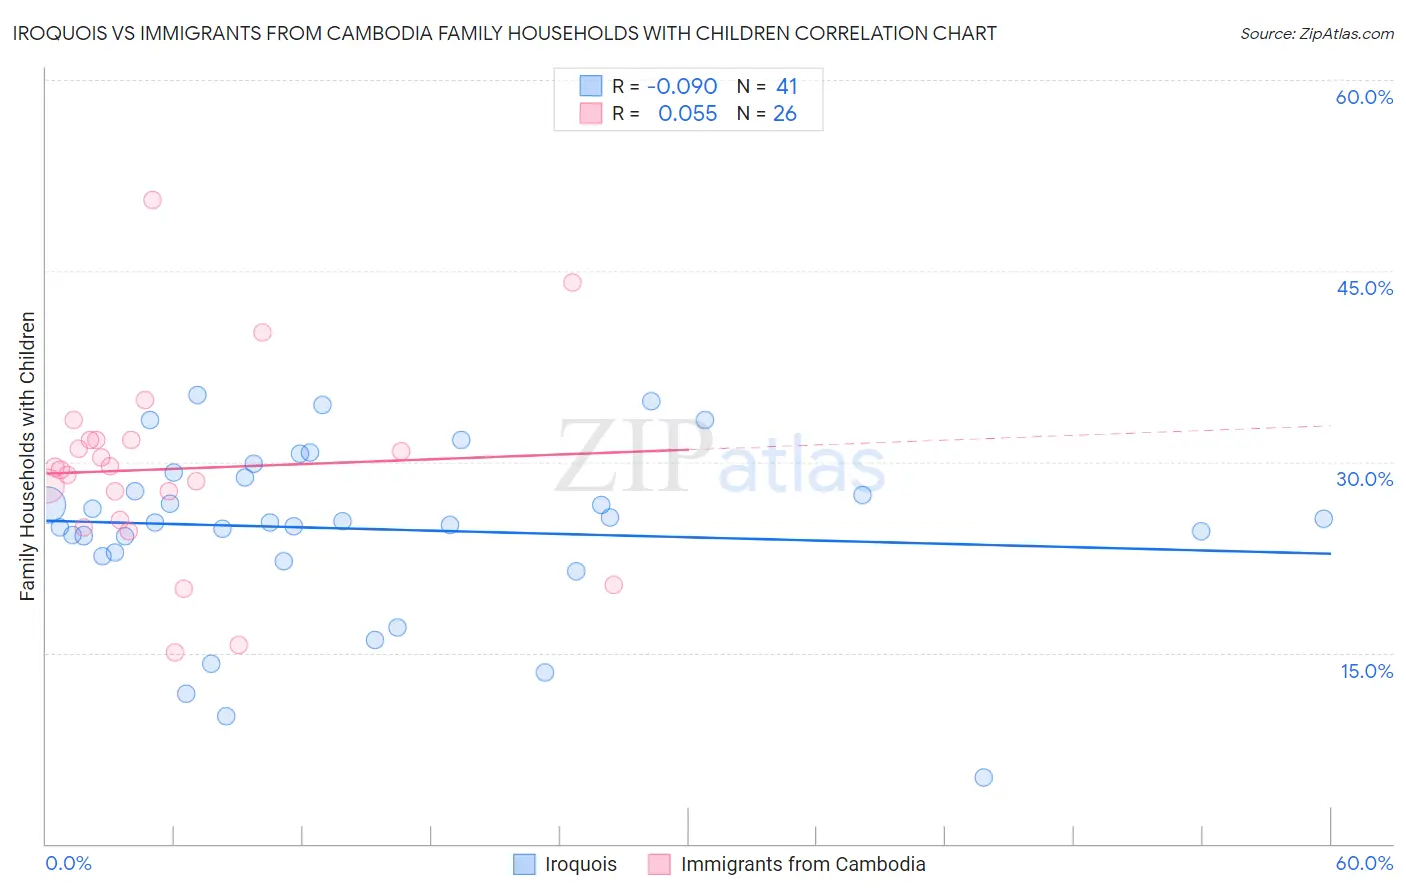
Iroquois vs Immigrants from Cambodia Family Households with Children Correlation Chart
The statistical analysis conducted on geographies consisting of 207,224,284 people shows a slight negative correlation between the proportion of Iroquois and percentage of family households with children in the United States with a correlation coefficient (R) of -0.090 and weighted average of 26.1%. Similarly, the statistical analysis conducted on geographies consisting of 205,128,905 people shows a slight positive correlation between the proportion of Immigrants from Cambodia and percentage of family households with children in the United States with a correlation coefficient (R) of 0.055 and weighted average of 28.9%, a difference of 10.8%.
Family Households with Children Correlation Summary
| Measurement | Iroquois | Immigrants from Cambodia |
| Minimum | 5.2% | 15.0% |
| Maximum | 35.2% | 50.6% |
| Range | 30.1% | 35.6% |
| Mean | 24.7% | 29.4% |
| Median | 25.3% | 29.5% |
| Interquartile 25% (IQ1) | 22.7% | 25.4% |
| Interquartile 75% (IQ3) | 29.0% | 31.7% |
| Interquartile Range (IQR) | 6.2% | 6.3% |
| Standard Deviation (Sample) | 6.8% | 7.7% |
| Standard Deviation (Population) | 6.7% | 7.5% |
Similar Demographics by Family Households with Children
Demographics Similar to Iroquois by Family Households with Children
In terms of family households with children, the demographic groups most similar to Iroquois are Ottawa (26.1%, a difference of 0.050%), Immigrants from France (26.0%, a difference of 0.090%), Tlingit-Haida (26.0%, a difference of 0.10%), British West Indian (26.0%, a difference of 0.12%), and Estonian (26.1%, a difference of 0.13%).
| Demographics | Rating | Rank | Family Households with Children |
| Colville | 0.0 /100 | #311 | Tragic 26.2% |
| Immigrants | Czechoslovakia | 0.0 /100 | #312 | Tragic 26.2% |
| Cree | 0.0 /100 | #313 | Tragic 26.2% |
| French Canadians | 0.0 /100 | #314 | Tragic 26.1% |
| Immigrants | Norway | 0.0 /100 | #315 | Tragic 26.1% |
| Estonians | 0.0 /100 | #316 | Tragic 26.1% |
| Ottawa | 0.0 /100 | #317 | Tragic 26.1% |
| Iroquois | 0.0 /100 | #318 | Tragic 26.1% |
| Immigrants | France | 0.0 /100 | #319 | Tragic 26.0% |
| Tlingit-Haida | 0.0 /100 | #320 | Tragic 26.0% |
| British West Indians | 0.0 /100 | #321 | Tragic 26.0% |
| Immigrants | Greece | 0.0 /100 | #322 | Tragic 26.0% |
| Immigrants | Australia | 0.0 /100 | #323 | Tragic 26.0% |
| Chinese | 0.0 /100 | #324 | Tragic 26.0% |
| Barbadians | 0.0 /100 | #325 | Tragic 26.0% |
Demographics Similar to Immigrants from Cambodia by Family Households with Children
In terms of family households with children, the demographic groups most similar to Immigrants from Cambodia are Guatemalan (28.9%, a difference of 0.070%), Sierra Leonean (28.9%, a difference of 0.080%), Immigrants from Asia (28.8%, a difference of 0.14%), Immigrants from Peru (28.9%, a difference of 0.15%), and Immigrants (28.9%, a difference of 0.19%).
| Demographics | Rating | Rank | Family Households with Children |
| Immigrants | Philippines | 100.0 /100 | #46 | Exceptional 29.0% |
| Peruvians | 100.0 /100 | #47 | Exceptional 29.0% |
| Apache | 100.0 /100 | #48 | Exceptional 29.0% |
| Jordanians | 100.0 /100 | #49 | Exceptional 29.0% |
| Immigrants | Immigrants | 100.0 /100 | #50 | Exceptional 28.9% |
| Immigrants | Peru | 100.0 /100 | #51 | Exceptional 28.9% |
| Guatemalans | 100.0 /100 | #52 | Exceptional 28.9% |
| Immigrants | Cambodia | 100.0 /100 | #53 | Exceptional 28.9% |
| Sierra Leoneans | 100.0 /100 | #54 | Exceptional 28.9% |
| Immigrants | Asia | 100.0 /100 | #55 | Exceptional 28.8% |
| Immigrants | Guatemala | 100.0 /100 | #56 | Exceptional 28.8% |
| Danes | 100.0 /100 | #57 | Exceptional 28.7% |
| Hawaiians | 100.0 /100 | #58 | Exceptional 28.7% |
| Immigrants | Nigeria | 100.0 /100 | #59 | Exceptional 28.6% |
| Hmong | 99.9 /100 | #60 | Exceptional 28.6% |