Iraqi vs Immigrants from Romania Cognitive Disability
COMPARE
Iraqi
Immigrants from Romania
Cognitive Disability
Cognitive Disability Comparison
Iraqis
Immigrants from Romania
17.8%
COGNITIVE DISABILITY
1.4/ 100
METRIC RATING
240th/ 347
METRIC RANK
16.4%
COGNITIVE DISABILITY
99.9/ 100
METRIC RATING
31st/ 347
METRIC RANK
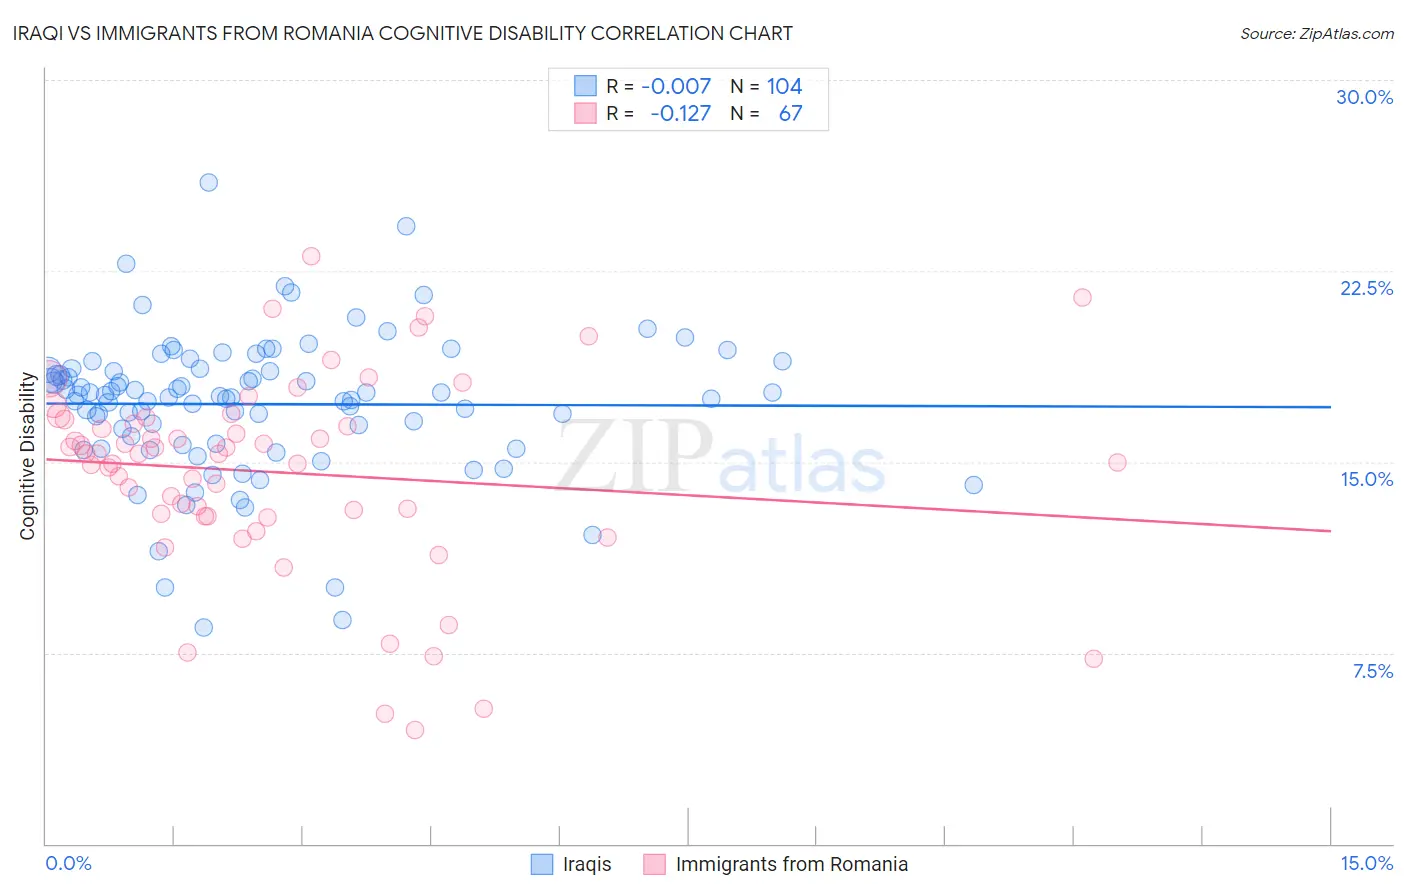
Iraqi vs Immigrants from Romania Cognitive Disability Correlation Chart
The statistical analysis conducted on geographies consisting of 170,645,989 people shows no correlation between the proportion of Iraqis and percentage of population with cognitive disability in the United States with a correlation coefficient (R) of -0.007 and weighted average of 17.8%. Similarly, the statistical analysis conducted on geographies consisting of 256,996,926 people shows a poor negative correlation between the proportion of Immigrants from Romania and percentage of population with cognitive disability in the United States with a correlation coefficient (R) of -0.127 and weighted average of 16.4%, a difference of 8.6%.
Cognitive Disability Correlation Summary
| Measurement | Iraqi | Immigrants from Romania |
| Minimum | 8.5% | 4.5% |
| Maximum | 25.9% | 23.1% |
| Range | 17.5% | 18.6% |
| Mean | 17.3% | 14.6% |
| Median | 17.6% | 15.3% |
| Interquartile 25% (IQ1) | 15.8% | 12.9% |
| Interquartile 75% (IQ3) | 18.6% | 16.7% |
| Interquartile Range (IQR) | 2.8% | 3.8% |
| Standard Deviation (Sample) | 2.8% | 3.9% |
| Standard Deviation (Population) | 2.8% | 3.8% |
Similar Demographics by Cognitive Disability
Demographics Similar to Iraqis by Cognitive Disability
In terms of cognitive disability, the demographic groups most similar to Iraqis are Cajun (17.8%, a difference of 0.040%), Mexican (17.8%, a difference of 0.14%), Cheyenne (17.8%, a difference of 0.16%), Paiute (17.8%, a difference of 0.16%), and Immigrants from Mexico (17.8%, a difference of 0.20%).
| Demographics | Rating | Rank | Cognitive Disability |
| Panamanians | 2.1 /100 | #233 | Tragic 17.8% |
| Osage | 2.0 /100 | #234 | Tragic 17.8% |
| Spanish American Indians | 2.0 /100 | #235 | Tragic 17.8% |
| Immigrants | Iraq | 1.8 /100 | #236 | Tragic 17.8% |
| Immigrants | Mexico | 1.8 /100 | #237 | Tragic 17.8% |
| Cheyenne | 1.7 /100 | #238 | Tragic 17.8% |
| Cajuns | 1.4 /100 | #239 | Tragic 17.8% |
| Iraqis | 1.4 /100 | #240 | Tragic 17.8% |
| Mexicans | 1.1 /100 | #241 | Tragic 17.8% |
| Paiute | 1.1 /100 | #242 | Tragic 17.8% |
| Immigrants | Bangladesh | 1.0 /100 | #243 | Tragic 17.8% |
| Jamaicans | 0.9 /100 | #244 | Tragic 17.9% |
| Trinidadians and Tobagonians | 0.8 /100 | #245 | Tragic 17.9% |
| Immigrants | Thailand | 0.8 /100 | #246 | Tragic 17.9% |
| Samoans | 0.7 /100 | #247 | Tragic 17.9% |
Demographics Similar to Immigrants from Romania by Cognitive Disability
In terms of cognitive disability, the demographic groups most similar to Immigrants from Romania are Filipino (16.4%, a difference of 0.020%), Czech (16.4%, a difference of 0.020%), Immigrants from Pakistan (16.4%, a difference of 0.050%), Polish (16.4%, a difference of 0.050%), and Immigrants from Israel (16.4%, a difference of 0.050%).
| Demographics | Rating | Rank | Cognitive Disability |
| Immigrants | Argentina | 99.9 /100 | #24 | Exceptional 16.4% |
| Luxembourgers | 99.9 /100 | #25 | Exceptional 16.4% |
| Immigrants | Croatia | 99.9 /100 | #26 | Exceptional 16.4% |
| Immigrants | Pakistan | 99.9 /100 | #27 | Exceptional 16.4% |
| Poles | 99.9 /100 | #28 | Exceptional 16.4% |
| Filipinos | 99.9 /100 | #29 | Exceptional 16.4% |
| Czechs | 99.9 /100 | #30 | Exceptional 16.4% |
| Immigrants | Romania | 99.9 /100 | #31 | Exceptional 16.4% |
| Immigrants | Israel | 99.9 /100 | #32 | Exceptional 16.4% |
| Italians | 99.9 /100 | #33 | Exceptional 16.4% |
| Russians | 99.9 /100 | #34 | Exceptional 16.4% |
| Slovaks | 99.9 /100 | #35 | Exceptional 16.4% |
| Greeks | 99.9 /100 | #36 | Exceptional 16.4% |
| Slovenes | 99.9 /100 | #37 | Exceptional 16.5% |
| Immigrants | Eastern Europe | 99.9 /100 | #38 | Exceptional 16.5% |