Chilean vs Immigrants from Sri Lanka Female Disability
COMPARE
Chilean
Immigrants from Sri Lanka
Female Disability
Female Disability Comparison
Chileans
Immigrants from Sri Lanka
11.5%
FEMALE DISABILITY
99.8/ 100
METRIC RATING
72nd/ 347
METRIC RANK
10.9%
FEMALE DISABILITY
100.0/ 100
METRIC RATING
22nd/ 347
METRIC RANK
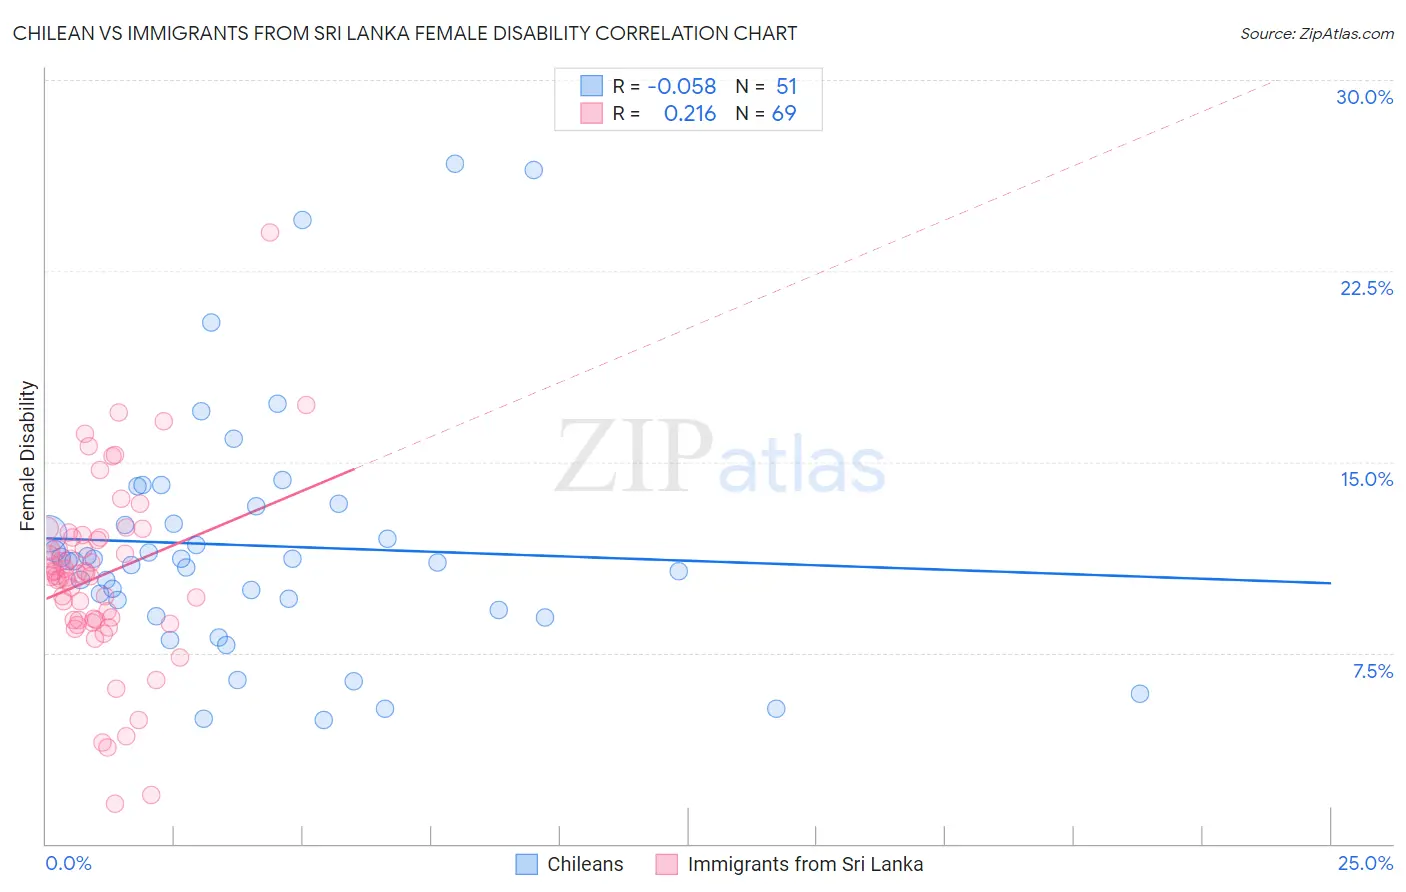
Chilean vs Immigrants from Sri Lanka Female Disability Correlation Chart
The statistical analysis conducted on geographies consisting of 256,651,441 people shows a slight negative correlation between the proportion of Chileans and percentage of females with a disability in the United States with a correlation coefficient (R) of -0.058 and weighted average of 11.5%. Similarly, the statistical analysis conducted on geographies consisting of 149,700,552 people shows a weak positive correlation between the proportion of Immigrants from Sri Lanka and percentage of females with a disability in the United States with a correlation coefficient (R) of 0.216 and weighted average of 10.9%, a difference of 5.1%.
Female Disability Correlation Summary
| Measurement | Chilean | Immigrants from Sri Lanka |
| Minimum | 4.8% | 1.6% |
| Maximum | 26.7% | 24.0% |
| Range | 21.8% | 22.4% |
| Mean | 11.7% | 10.5% |
| Median | 11.1% | 10.5% |
| Interquartile 25% (IQ1) | 9.2% | 8.8% |
| Interquartile 75% (IQ3) | 13.3% | 12.0% |
| Interquartile Range (IQR) | 4.1% | 3.2% |
| Standard Deviation (Sample) | 4.8% | 3.6% |
| Standard Deviation (Population) | 4.7% | 3.6% |
Similar Demographics by Female Disability
Demographics Similar to Chileans by Female Disability
In terms of female disability, the demographic groups most similar to Chileans are Immigrants from Switzerland (11.5%, a difference of 0.020%), Immigrants from Ireland (11.5%, a difference of 0.070%), Bhutanese (11.5%, a difference of 0.090%), Immigrants from Chile (11.5%, a difference of 0.11%), and Colombian (11.5%, a difference of 0.12%).
| Demographics | Rating | Rank | Female Disability |
| Immigrants | South America | 99.9 /100 | #65 | Exceptional 11.4% |
| Salvadorans | 99.8 /100 | #66 | Exceptional 11.5% |
| Immigrants | Vietnam | 99.8 /100 | #67 | Exceptional 11.5% |
| Immigrants | Northern Africa | 99.8 /100 | #68 | Exceptional 11.5% |
| Colombians | 99.8 /100 | #69 | Exceptional 11.5% |
| Immigrants | Chile | 99.8 /100 | #70 | Exceptional 11.5% |
| Immigrants | Ireland | 99.8 /100 | #71 | Exceptional 11.5% |
| Chileans | 99.8 /100 | #72 | Exceptional 11.5% |
| Immigrants | Switzerland | 99.8 /100 | #73 | Exceptional 11.5% |
| Bhutanese | 99.8 /100 | #74 | Exceptional 11.5% |
| Immigrants | Lebanon | 99.7 /100 | #75 | Exceptional 11.5% |
| Immigrants | Eritrea | 99.7 /100 | #76 | Exceptional 11.5% |
| Immigrants | Afghanistan | 99.7 /100 | #77 | Exceptional 11.5% |
| Immigrants | South Africa | 99.7 /100 | #78 | Exceptional 11.5% |
| Sierra Leoneans | 99.7 /100 | #79 | Exceptional 11.5% |
Demographics Similar to Immigrants from Sri Lanka by Female Disability
In terms of female disability, the demographic groups most similar to Immigrants from Sri Lanka are Asian (10.9%, a difference of 0.13%), Venezuelan (11.0%, a difference of 0.22%), Immigrants from Pakistan (10.9%, a difference of 0.49%), Immigrants from Venezuela (10.9%, a difference of 0.66%), and Immigrants from Argentina (11.0%, a difference of 0.79%).
| Demographics | Rating | Rank | Female Disability |
| Burmese | 100.0 /100 | #15 | Exceptional 10.7% |
| Okinawans | 100.0 /100 | #16 | Exceptional 10.8% |
| Indians (Asian) | 100.0 /100 | #17 | Exceptional 10.8% |
| Immigrants | Iran | 100.0 /100 | #18 | Exceptional 10.8% |
| Immigrants | Venezuela | 100.0 /100 | #19 | Exceptional 10.9% |
| Immigrants | Pakistan | 100.0 /100 | #20 | Exceptional 10.9% |
| Asians | 100.0 /100 | #21 | Exceptional 10.9% |
| Immigrants | Sri Lanka | 100.0 /100 | #22 | Exceptional 10.9% |
| Venezuelans | 100.0 /100 | #23 | Exceptional 11.0% |
| Immigrants | Argentina | 100.0 /100 | #24 | Exceptional 11.0% |
| Immigrants | Asia | 100.0 /100 | #25 | Exceptional 11.0% |
| Argentineans | 100.0 /100 | #26 | Exceptional 11.0% |
| Immigrants | Turkey | 100.0 /100 | #27 | Exceptional 11.1% |
| Egyptians | 100.0 /100 | #28 | Exceptional 11.1% |
| Immigrants | Malaysia | 100.0 /100 | #29 | Exceptional 11.1% |