Iranian vs Immigrants from Congo Disability Age 65 to 74
COMPARE
Iranian
Immigrants from Congo
Disability Age 65 to 74
Disability Age 65 to 74 Comparison
Iranians
Immigrants from Congo
19.9%
DISABILITY AGE 65 TO 74
100.0/ 100
METRIC RATING
6th/ 347
METRIC RANK
26.0%
DISABILITY AGE 65 TO 74
0.0/ 100
METRIC RATING
285th/ 347
METRIC RANK
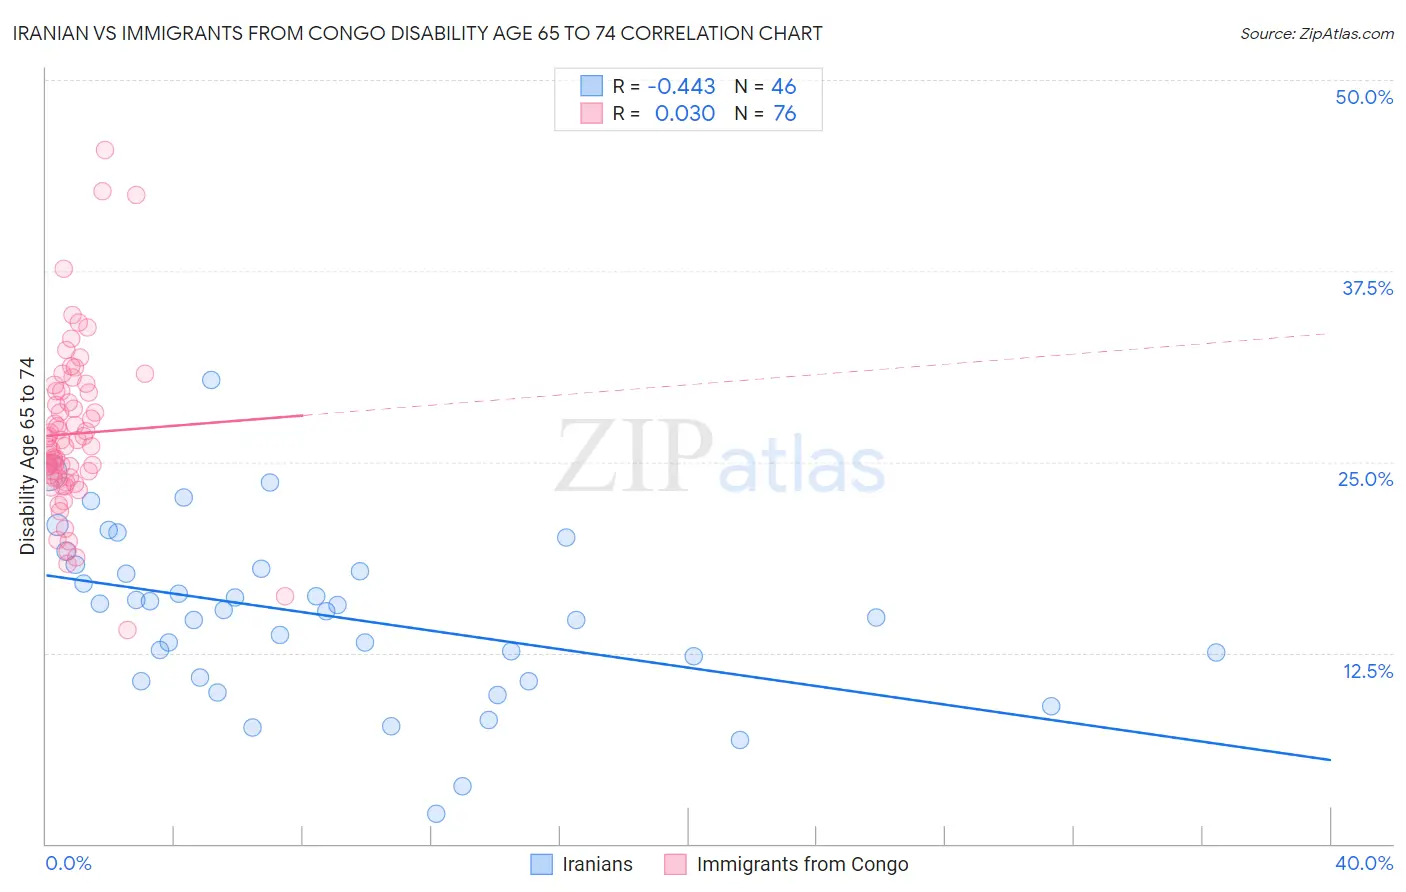
Iranian vs Immigrants from Congo Disability Age 65 to 74 Correlation Chart
The statistical analysis conducted on geographies consisting of 316,255,401 people shows a moderate negative correlation between the proportion of Iranians and percentage of population with a disability between the ages 65 and 75 in the United States with a correlation coefficient (R) of -0.443 and weighted average of 19.9%. Similarly, the statistical analysis conducted on geographies consisting of 92,066,096 people shows no correlation between the proportion of Immigrants from Congo and percentage of population with a disability between the ages 65 and 75 in the United States with a correlation coefficient (R) of 0.030 and weighted average of 26.0%, a difference of 30.4%.
Disability Age 65 to 74 Correlation Summary
| Measurement | Iranian | Immigrants from Congo |
| Minimum | 2.0% | 14.0% |
| Maximum | 30.4% | 45.5% |
| Range | 28.4% | 31.5% |
| Mean | 14.9% | 26.8% |
| Median | 15.3% | 26.1% |
| Interquartile 25% (IQ1) | 10.9% | 24.0% |
| Interquartile 75% (IQ3) | 18.0% | 29.6% |
| Interquartile Range (IQR) | 7.1% | 5.6% |
| Standard Deviation (Sample) | 5.6% | 5.4% |
| Standard Deviation (Population) | 5.5% | 5.4% |
Similar Demographics by Disability Age 65 to 74
Demographics Similar to Iranians by Disability Age 65 to 74
In terms of disability age 65 to 74, the demographic groups most similar to Iranians are Immigrants from Israel (19.9%, a difference of 0.11%), Immigrants from Hong Kong (19.9%, a difference of 0.41%), Cypriot (20.1%, a difference of 0.67%), Thai (20.1%, a difference of 0.70%), and Immigrants from India (19.7%, a difference of 1.3%).
| Demographics | Rating | Rank | Disability Age 65 to 74 |
| Immigrants | Taiwan | 100.0 /100 | #1 | Exceptional 18.8% |
| Filipinos | 100.0 /100 | #2 | Exceptional 19.0% |
| Immigrants | India | 100.0 /100 | #3 | Exceptional 19.7% |
| Immigrants | Hong Kong | 100.0 /100 | #4 | Exceptional 19.9% |
| Immigrants | Israel | 100.0 /100 | #5 | Exceptional 19.9% |
| Iranians | 100.0 /100 | #6 | Exceptional 19.9% |
| Cypriots | 100.0 /100 | #7 | Exceptional 20.1% |
| Thais | 100.0 /100 | #8 | Exceptional 20.1% |
| Immigrants | China | 100.0 /100 | #9 | Exceptional 20.3% |
| Immigrants | Eastern Asia | 100.0 /100 | #10 | Exceptional 20.3% |
| Immigrants | Ireland | 100.0 /100 | #11 | Exceptional 20.3% |
| Immigrants | Korea | 100.0 /100 | #12 | Exceptional 20.4% |
| Immigrants | Singapore | 100.0 /100 | #13 | Exceptional 20.4% |
| Indians (Asian) | 100.0 /100 | #14 | Exceptional 20.5% |
| Paraguayans | 100.0 /100 | #15 | Exceptional 20.5% |
Demographics Similar to Immigrants from Congo by Disability Age 65 to 74
In terms of disability age 65 to 74, the demographic groups most similar to Immigrants from Congo are Immigrants from the Azores (26.0%, a difference of 0.020%), Spanish American (25.9%, a difference of 0.21%), Delaware (25.9%, a difference of 0.35%), Immigrants from Honduras (25.9%, a difference of 0.42%), and Immigrants from Micronesia (26.1%, a difference of 0.43%).
| Demographics | Rating | Rank | Disability Age 65 to 74 |
| Immigrants | Belize | 0.1 /100 | #278 | Tragic 25.8% |
| U.S. Virgin Islanders | 0.1 /100 | #279 | Tragic 25.9% |
| Cree | 0.1 /100 | #280 | Tragic 25.9% |
| Immigrants | Honduras | 0.1 /100 | #281 | Tragic 25.9% |
| Delaware | 0.1 /100 | #282 | Tragic 25.9% |
| Spanish Americans | 0.0 /100 | #283 | Tragic 25.9% |
| Immigrants | Azores | 0.0 /100 | #284 | Tragic 26.0% |
| Immigrants | Congo | 0.0 /100 | #285 | Tragic 26.0% |
| Immigrants | Micronesia | 0.0 /100 | #286 | Tragic 26.1% |
| Immigrants | Laos | 0.0 /100 | #287 | Tragic 26.1% |
| Mexican American Indians | 0.0 /100 | #288 | Tragic 26.2% |
| Africans | 0.0 /100 | #289 | Tragic 26.2% |
| Immigrants | Cabo Verde | 0.0 /100 | #290 | Tragic 26.3% |
| Spanish American Indians | 0.0 /100 | #291 | Tragic 26.4% |
| Blackfeet | 0.0 /100 | #292 | Tragic 26.6% |