Iranian vs Yuman Disability Age 65 to 74
COMPARE
Iranian
Yuman
Disability Age 65 to 74
Disability Age 65 to 74 Comparison
Iranians
Yuman
19.9%
DISABILITY AGE 65 TO 74
100.0/ 100
METRIC RATING
6th/ 347
METRIC RANK
31.5%
DISABILITY AGE 65 TO 74
0.0/ 100
METRIC RATING
336th/ 347
METRIC RANK
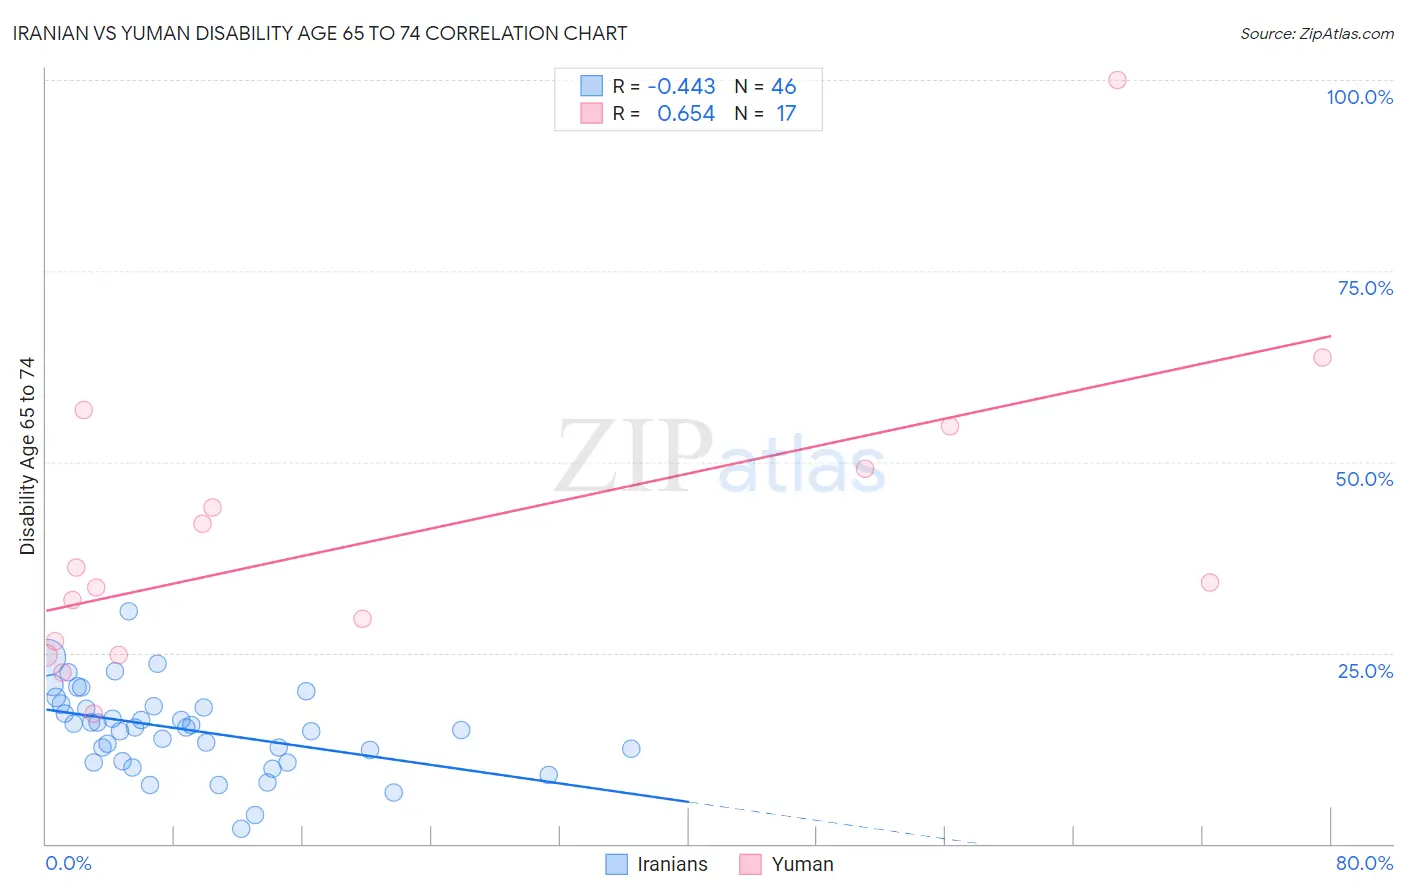
Iranian vs Yuman Disability Age 65 to 74 Correlation Chart
The statistical analysis conducted on geographies consisting of 316,255,401 people shows a moderate negative correlation between the proportion of Iranians and percentage of population with a disability between the ages 65 and 75 in the United States with a correlation coefficient (R) of -0.443 and weighted average of 19.9%. Similarly, the statistical analysis conducted on geographies consisting of 40,592,488 people shows a significant positive correlation between the proportion of Yuman and percentage of population with a disability between the ages 65 and 75 in the United States with a correlation coefficient (R) of 0.654 and weighted average of 31.5%, a difference of 57.9%.
Disability Age 65 to 74 Correlation Summary
| Measurement | Iranian | Yuman |
| Minimum | 2.0% | 17.1% |
| Maximum | 30.4% | 100.0% |
| Range | 28.4% | 82.9% |
| Mean | 14.9% | 40.6% |
| Median | 15.3% | 34.2% |
| Interquartile 25% (IQ1) | 10.9% | 25.6% |
| Interquartile 75% (IQ3) | 18.0% | 51.9% |
| Interquartile Range (IQR) | 7.1% | 26.3% |
| Standard Deviation (Sample) | 5.6% | 20.2% |
| Standard Deviation (Population) | 5.5% | 19.6% |
Similar Demographics by Disability Age 65 to 74
Demographics Similar to Iranians by Disability Age 65 to 74
In terms of disability age 65 to 74, the demographic groups most similar to Iranians are Immigrants from Israel (19.9%, a difference of 0.11%), Immigrants from Hong Kong (19.9%, a difference of 0.41%), Cypriot (20.1%, a difference of 0.67%), Thai (20.1%, a difference of 0.70%), and Immigrants from India (19.7%, a difference of 1.3%).
| Demographics | Rating | Rank | Disability Age 65 to 74 |
| Immigrants | Taiwan | 100.0 /100 | #1 | Exceptional 18.8% |
| Filipinos | 100.0 /100 | #2 | Exceptional 19.0% |
| Immigrants | India | 100.0 /100 | #3 | Exceptional 19.7% |
| Immigrants | Hong Kong | 100.0 /100 | #4 | Exceptional 19.9% |
| Immigrants | Israel | 100.0 /100 | #5 | Exceptional 19.9% |
| Iranians | 100.0 /100 | #6 | Exceptional 19.9% |
| Cypriots | 100.0 /100 | #7 | Exceptional 20.1% |
| Thais | 100.0 /100 | #8 | Exceptional 20.1% |
| Immigrants | China | 100.0 /100 | #9 | Exceptional 20.3% |
| Immigrants | Eastern Asia | 100.0 /100 | #10 | Exceptional 20.3% |
| Immigrants | Ireland | 100.0 /100 | #11 | Exceptional 20.3% |
| Immigrants | Korea | 100.0 /100 | #12 | Exceptional 20.4% |
| Immigrants | Singapore | 100.0 /100 | #13 | Exceptional 20.4% |
| Indians (Asian) | 100.0 /100 | #14 | Exceptional 20.5% |
| Paraguayans | 100.0 /100 | #15 | Exceptional 20.5% |
Demographics Similar to Yuman by Disability Age 65 to 74
In terms of disability age 65 to 74, the demographic groups most similar to Yuman are Cheyenne (31.1%, a difference of 1.3%), Houma (32.3%, a difference of 2.6%), Alaskan Athabascan (32.4%, a difference of 2.8%), Alaska Native (30.6%, a difference of 2.8%), and Colville (30.5%, a difference of 3.1%).
| Demographics | Rating | Rank | Disability Age 65 to 74 |
| Choctaw | 0.0 /100 | #329 | Tragic 30.2% |
| Creek | 0.0 /100 | #330 | Tragic 30.2% |
| Chickasaw | 0.0 /100 | #331 | Tragic 30.2% |
| Natives/Alaskans | 0.0 /100 | #332 | Tragic 30.4% |
| Colville | 0.0 /100 | #333 | Tragic 30.5% |
| Alaska Natives | 0.0 /100 | #334 | Tragic 30.6% |
| Cheyenne | 0.0 /100 | #335 | Tragic 31.1% |
| Yuman | 0.0 /100 | #336 | Tragic 31.5% |
| Houma | 0.0 /100 | #337 | Tragic 32.3% |
| Alaskan Athabascans | 0.0 /100 | #338 | Tragic 32.4% |
| Kiowa | 0.0 /100 | #339 | Tragic 32.6% |
| Lumbee | 0.0 /100 | #340 | Tragic 32.7% |
| Tsimshian | 0.0 /100 | #341 | Tragic 32.9% |
| Pueblo | 0.0 /100 | #342 | Tragic 33.1% |
| Navajo | 0.0 /100 | #343 | Tragic 33.3% |