Inupiat vs Kenyan Disability Age Over 75
COMPARE
Inupiat
Kenyan
Disability Age Over 75
Disability Age Over 75 Comparison
Inupiat
Kenyans
58.4%
DISABILITY AGE OVER 75
0.0/ 100
METRIC RATING
345th/ 347
METRIC RANK
47.2%
DISABILITY AGE OVER 75
58.8/ 100
METRIC RATING
168th/ 347
METRIC RANK
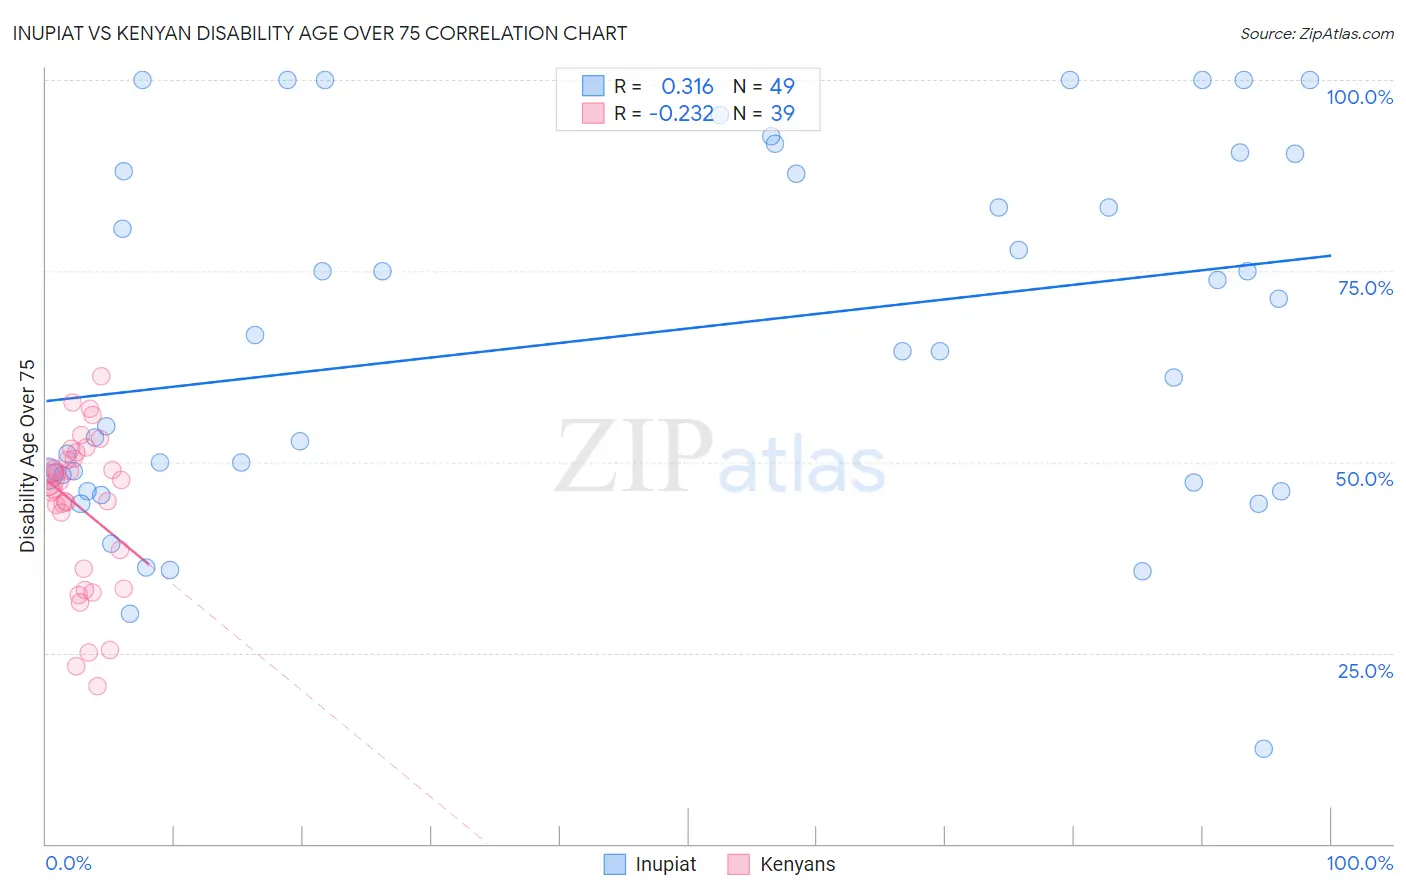
Inupiat vs Kenyan Disability Age Over 75 Correlation Chart
The statistical analysis conducted on geographies consisting of 96,244,467 people shows a mild positive correlation between the proportion of Inupiat and percentage of population with a disability over the age of 75 in the United States with a correlation coefficient (R) of 0.316 and weighted average of 58.4%. Similarly, the statistical analysis conducted on geographies consisting of 167,961,440 people shows a weak negative correlation between the proportion of Kenyans and percentage of population with a disability over the age of 75 in the United States with a correlation coefficient (R) of -0.232 and weighted average of 47.2%, a difference of 23.6%.
Disability Age Over 75 Correlation Summary
| Measurement | Inupiat | Kenyan |
| Minimum | 12.5% | 20.6% |
| Maximum | 100.0% | 61.2% |
| Range | 87.5% | 40.7% |
| Mean | 66.5% | 44.1% |
| Median | 64.5% | 46.9% |
| Interquartile 25% (IQ1) | 47.8% | 36.0% |
| Interquartile 75% (IQ3) | 89.2% | 50.5% |
| Interquartile Range (IQR) | 41.4% | 14.4% |
| Standard Deviation (Sample) | 23.4% | 10.0% |
| Standard Deviation (Population) | 23.2% | 9.9% |
Similar Demographics by Disability Age Over 75
Demographics Similar to Inupiat by Disability Age Over 75
In terms of disability age over 75, the demographic groups most similar to Inupiat are Navajo (58.3%, a difference of 0.20%), Tsimshian (59.2%, a difference of 1.4%), Tohono O'odham (56.7%, a difference of 3.0%), Lumbee (56.2%, a difference of 3.8%), and Houma (56.2%, a difference of 4.0%).
| Demographics | Rating | Rank | Disability Age Over 75 |
| Apache | 0.0 /100 | #333 | Tragic 53.6% |
| Alaskan Athabascans | 0.0 /100 | #334 | Tragic 54.0% |
| Kiowa | 0.0 /100 | #335 | Tragic 54.2% |
| Immigrants | Armenia | 0.0 /100 | #336 | Tragic 54.3% |
| Yuman | 0.0 /100 | #337 | Tragic 54.4% |
| Colville | 0.0 /100 | #338 | Tragic 55.4% |
| Pima | 0.0 /100 | #339 | Tragic 55.8% |
| Pueblo | 0.0 /100 | #340 | Tragic 55.9% |
| Houma | 0.0 /100 | #341 | Tragic 56.2% |
| Lumbee | 0.0 /100 | #342 | Tragic 56.2% |
| Tohono O'odham | 0.0 /100 | #343 | Tragic 56.7% |
| Navajo | 0.0 /100 | #344 | Tragic 58.3% |
| Inupiat | 0.0 /100 | #345 | Tragic 58.4% |
| Tsimshian | 0.0 /100 | #346 | Tragic 59.2% |
| Yup'ik | 0.0 /100 | #347 | Tragic 61.1% |
Demographics Similar to Kenyans by Disability Age Over 75
In terms of disability age over 75, the demographic groups most similar to Kenyans are Celtic (47.2%, a difference of 0.0%), German Russian (47.3%, a difference of 0.060%), Moroccan (47.2%, a difference of 0.10%), Immigrants from Africa (47.3%, a difference of 0.12%), and Immigrants from Zimbabwe (47.2%, a difference of 0.13%).
| Demographics | Rating | Rank | Disability Age Over 75 |
| South American Indians | 68.1 /100 | #161 | Good 47.1% |
| Pennsylvania Germans | 66.0 /100 | #162 | Good 47.2% |
| Immigrants | Eastern Africa | 65.5 /100 | #163 | Good 47.2% |
| French | 64.6 /100 | #164 | Good 47.2% |
| Immigrants | Zimbabwe | 64.4 /100 | #165 | Good 47.2% |
| Immigrants | Sierra Leone | 64.4 /100 | #166 | Good 47.2% |
| Moroccans | 62.9 /100 | #167 | Good 47.2% |
| Kenyans | 58.8 /100 | #168 | Average 47.2% |
| Celtics | 58.7 /100 | #169 | Average 47.2% |
| German Russians | 56.2 /100 | #170 | Average 47.3% |
| Immigrants | Africa | 53.6 /100 | #171 | Average 47.3% |
| Scotch-Irish | 52.5 /100 | #172 | Average 47.3% |
| Alsatians | 51.9 /100 | #173 | Average 47.3% |
| Whites/Caucasians | 50.0 /100 | #174 | Average 47.3% |
| Immigrants | Haiti | 49.7 /100 | #175 | Average 47.3% |