Immigrants from Zaire vs Kenyan Disability Age Over 75
COMPARE
Immigrants from Zaire
Kenyan
Disability Age Over 75
Disability Age Over 75 Comparison
Immigrants from Zaire
Kenyans
47.1%
DISABILITY AGE OVER 75
74.8/ 100
METRIC RATING
153rd/ 347
METRIC RANK
47.2%
DISABILITY AGE OVER 75
58.8/ 100
METRIC RATING
168th/ 347
METRIC RANK
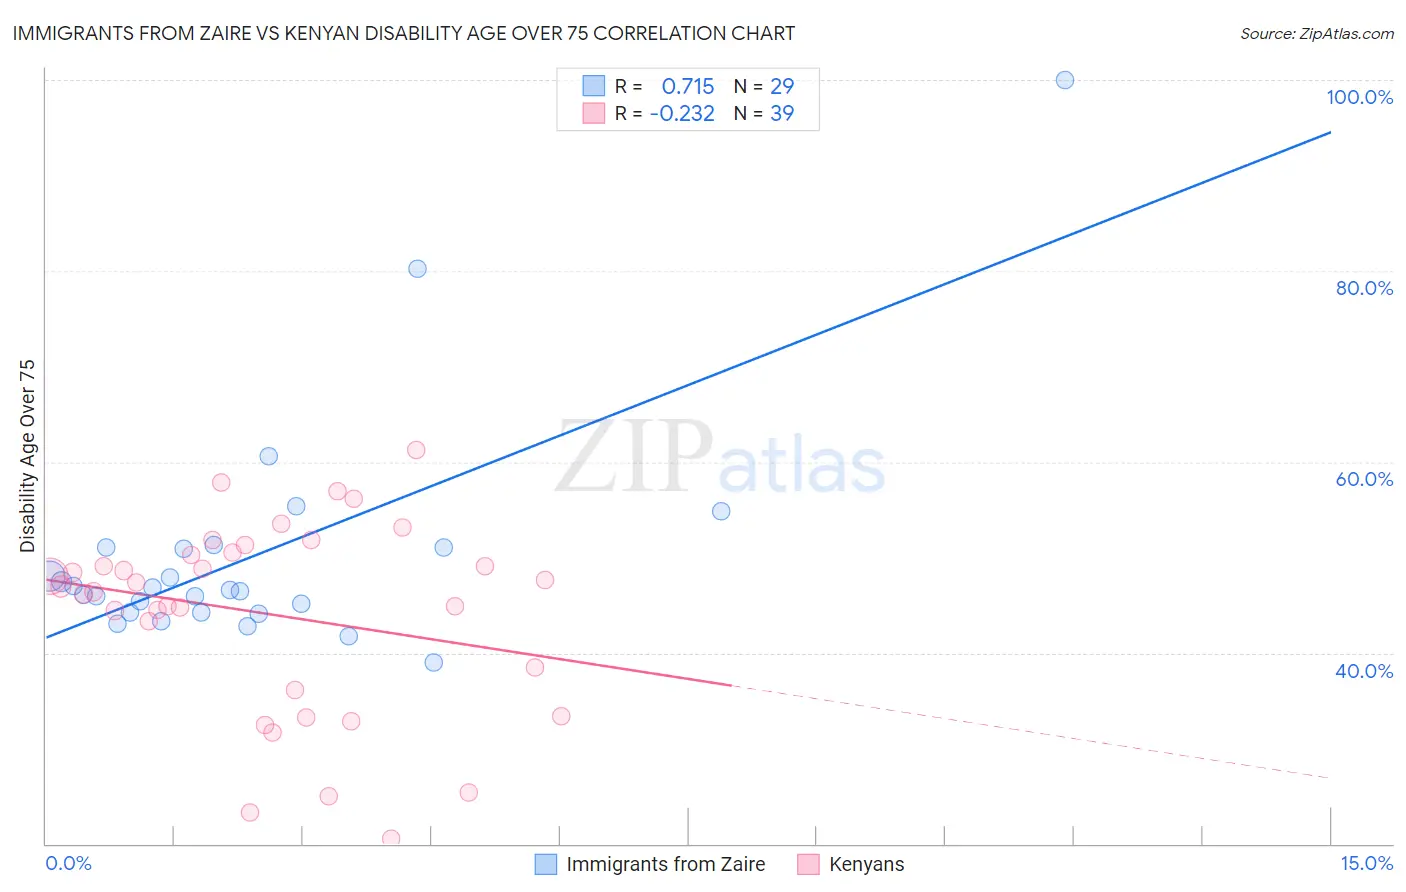
Immigrants from Zaire vs Kenyan Disability Age Over 75 Correlation Chart
The statistical analysis conducted on geographies consisting of 107,207,758 people shows a strong positive correlation between the proportion of Immigrants from Zaire and percentage of population with a disability over the age of 75 in the United States with a correlation coefficient (R) of 0.715 and weighted average of 47.1%. Similarly, the statistical analysis conducted on geographies consisting of 167,961,440 people shows a weak negative correlation between the proportion of Kenyans and percentage of population with a disability over the age of 75 in the United States with a correlation coefficient (R) of -0.232 and weighted average of 47.2%, a difference of 0.41%.
Disability Age Over 75 Correlation Summary
| Measurement | Immigrants from Zaire | Kenyan |
| Minimum | 39.0% | 20.6% |
| Maximum | 100.0% | 61.2% |
| Range | 61.0% | 40.7% |
| Mean | 50.2% | 44.1% |
| Median | 46.6% | 46.9% |
| Interquartile 25% (IQ1) | 44.2% | 36.0% |
| Interquartile 75% (IQ3) | 51.0% | 50.5% |
| Interquartile Range (IQR) | 6.8% | 14.4% |
| Standard Deviation (Sample) | 12.2% | 10.0% |
| Standard Deviation (Population) | 12.0% | 9.9% |
Demographics Similar to Immigrants from Zaire and Kenyans by Disability Age Over 75
In terms of disability age over 75, the demographic groups most similar to Immigrants from Zaire are Immigrants from Belarus (47.1%, a difference of 0.0%), Immigrants from Iran (47.1%, a difference of 0.010%), Arab (47.1%, a difference of 0.040%), Immigrants from Asia (47.0%, a difference of 0.050%), and Bhutanese (47.1%, a difference of 0.070%). Similarly, the demographic groups most similar to Kenyans are Celtic (47.2%, a difference of 0.0%), German Russian (47.3%, a difference of 0.060%), Moroccan (47.2%, a difference of 0.10%), Immigrants from Zimbabwe (47.2%, a difference of 0.13%), and Immigrants from Sierra Leone (47.2%, a difference of 0.13%).
| Demographics | Rating | Rank | Disability Age Over 75 |
| Immigrants | Russia | 79.3 /100 | #150 | Good 47.0% |
| French Canadians | 79.0 /100 | #151 | Good 47.0% |
| Immigrants | Asia | 76.5 /100 | #152 | Good 47.0% |
| Immigrants | Zaire | 74.8 /100 | #153 | Good 47.1% |
| Immigrants | Belarus | 74.8 /100 | #154 | Good 47.1% |
| Immigrants | Iran | 74.7 /100 | #155 | Good 47.1% |
| Arabs | 73.3 /100 | #156 | Good 47.1% |
| Bhutanese | 72.6 /100 | #157 | Good 47.1% |
| Immigrants | Guyana | 71.9 /100 | #158 | Good 47.1% |
| Immigrants | Morocco | 71.4 /100 | #159 | Good 47.1% |
| Immigrants | Middle Africa | 68.3 /100 | #160 | Good 47.1% |
| South American Indians | 68.1 /100 | #161 | Good 47.1% |
| Pennsylvania Germans | 66.0 /100 | #162 | Good 47.2% |
| Immigrants | Eastern Africa | 65.5 /100 | #163 | Good 47.2% |
| French | 64.6 /100 | #164 | Good 47.2% |
| Immigrants | Zimbabwe | 64.4 /100 | #165 | Good 47.2% |
| Immigrants | Sierra Leone | 64.4 /100 | #166 | Good 47.2% |
| Moroccans | 62.9 /100 | #167 | Good 47.2% |
| Kenyans | 58.8 /100 | #168 | Average 47.2% |
| Celtics | 58.7 /100 | #169 | Average 47.2% |
| German Russians | 56.2 /100 | #170 | Average 47.3% |