Scandinavian vs Immigrants from Philippines Vision Disability
COMPARE
Scandinavian
Immigrants from Philippines
Vision Disability
Vision Disability Comparison
Scandinavians
Immigrants from Philippines
2.2%
VISION DISABILITY
50.0/ 100
METRIC RATING
173rd/ 347
METRIC RANK
2.1%
VISION DISABILITY
91.4/ 100
METRIC RATING
118th/ 347
METRIC RANK
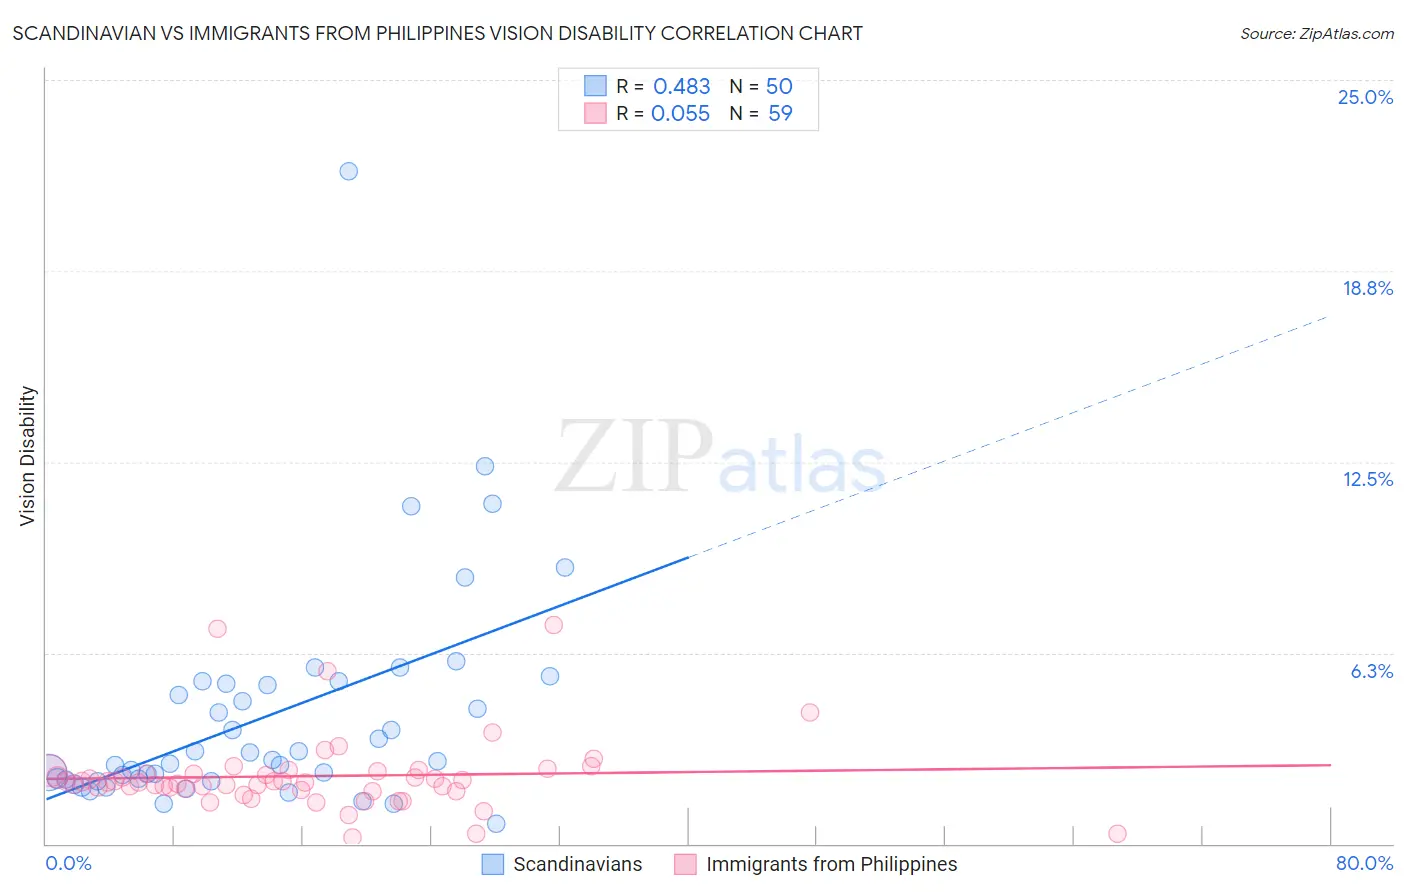
Scandinavian vs Immigrants from Philippines Vision Disability Correlation Chart
The statistical analysis conducted on geographies consisting of 471,900,698 people shows a moderate positive correlation between the proportion of Scandinavians and percentage of population with vision disability in the United States with a correlation coefficient (R) of 0.483 and weighted average of 2.2%. Similarly, the statistical analysis conducted on geographies consisting of 470,744,203 people shows a slight positive correlation between the proportion of Immigrants from Philippines and percentage of population with vision disability in the United States with a correlation coefficient (R) of 0.055 and weighted average of 2.1%, a difference of 3.8%.
Vision Disability Correlation Summary
| Measurement | Scandinavian | Immigrants from Philippines |
| Minimum | 0.66% | 0.22% |
| Maximum | 22.0% | 7.1% |
| Range | 21.3% | 6.9% |
| Mean | 4.2% | 2.2% |
| Median | 2.7% | 2.0% |
| Interquartile 25% (IQ1) | 2.1% | 1.8% |
| Interquartile 75% (IQ3) | 5.2% | 2.4% |
| Interquartile Range (IQR) | 3.1% | 0.59% |
| Standard Deviation (Sample) | 3.7% | 1.2% |
| Standard Deviation (Population) | 3.7% | 1.2% |
Similar Demographics by Vision Disability
Demographics Similar to Scandinavians by Vision Disability
In terms of vision disability, the demographic groups most similar to Scandinavians are Northern European (2.2%, a difference of 0.0%), Immigrants from Canada (2.2%, a difference of 0.0%), Immigrants from Fiji (2.2%, a difference of 0.15%), Yugoslavian (2.2%, a difference of 0.22%), and Slavic (2.2%, a difference of 0.26%).
| Demographics | Rating | Rank | Vision Disability |
| Immigrants | England | 62.8 /100 | #166 | Good 2.1% |
| Immigrants | Africa | 62.6 /100 | #167 | Good 2.1% |
| Brazilians | 62.2 /100 | #168 | Good 2.1% |
| South American Indians | 57.4 /100 | #169 | Average 2.2% |
| Swiss | 55.7 /100 | #170 | Average 2.2% |
| Lebanese | 54.3 /100 | #171 | Average 2.2% |
| Northern Europeans | 50.1 /100 | #172 | Average 2.2% |
| Scandinavians | 50.0 /100 | #173 | Average 2.2% |
| Immigrants | Canada | 50.0 /100 | #174 | Average 2.2% |
| Immigrants | Fiji | 47.6 /100 | #175 | Average 2.2% |
| Yugoslavians | 46.5 /100 | #176 | Average 2.2% |
| Slavs | 46.0 /100 | #177 | Average 2.2% |
| Immigrants | Oceania | 45.1 /100 | #178 | Average 2.2% |
| Immigrants | North America | 44.5 /100 | #179 | Average 2.2% |
| Uruguayans | 42.7 /100 | #180 | Average 2.2% |
Demographics Similar to Immigrants from Philippines by Vision Disability
In terms of vision disability, the demographic groups most similar to Immigrants from Philippines are Immigrants from Uganda (2.1%, a difference of 0.0%), Immigrants from Zimbabwe (2.1%, a difference of 0.070%), Polish (2.1%, a difference of 0.13%), Immigrants from Vietnam (2.1%, a difference of 0.18%), and Ugandan (2.1%, a difference of 0.18%).
| Demographics | Rating | Rank | Vision Disability |
| Peruvians | 93.5 /100 | #111 | Exceptional 2.1% |
| Immigrants | Denmark | 92.9 /100 | #112 | Exceptional 2.1% |
| Kenyans | 92.5 /100 | #113 | Exceptional 2.1% |
| Croatians | 92.3 /100 | #114 | Exceptional 2.1% |
| Immigrants | Vietnam | 92.2 /100 | #115 | Exceptional 2.1% |
| Ugandans | 92.2 /100 | #116 | Exceptional 2.1% |
| Poles | 92.0 /100 | #117 | Exceptional 2.1% |
| Immigrants | Philippines | 91.4 /100 | #118 | Exceptional 2.1% |
| Immigrants | Uganda | 91.4 /100 | #119 | Exceptional 2.1% |
| Immigrants | Zimbabwe | 91.0 /100 | #120 | Exceptional 2.1% |
| Immigrants | Scotland | 90.4 /100 | #121 | Exceptional 2.1% |
| Immigrants | Ukraine | 90.4 /100 | #122 | Exceptional 2.1% |
| Immigrants | Albania | 90.4 /100 | #123 | Exceptional 2.1% |
| Immigrants | Spain | 89.8 /100 | #124 | Excellent 2.1% |
| Immigrants | Venezuela | 89.8 /100 | #125 | Excellent 2.1% |