Immigrants from Western Europe vs Immigrants from Bangladesh Vision Disability
COMPARE
Immigrants from Western Europe
Immigrants from Bangladesh
Vision Disability
Vision Disability Comparison
Immigrants from Western Europe
Immigrants from Bangladesh
2.2%
VISION DISABILITY
41.1/ 100
METRIC RATING
181st/ 347
METRIC RANK
2.1%
VISION DISABILITY
65.5/ 100
METRIC RATING
164th/ 347
METRIC RANK
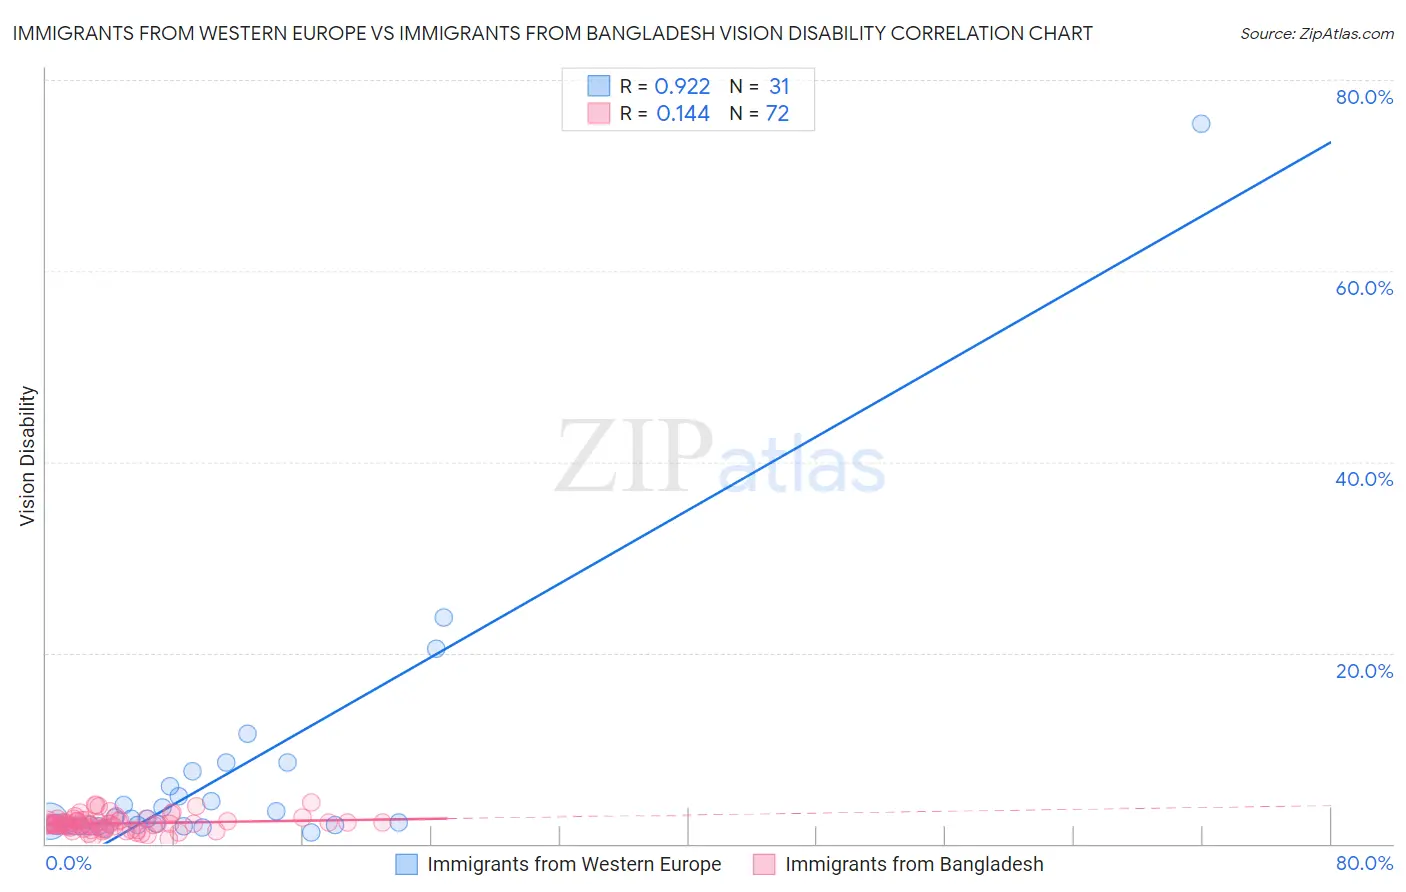
Immigrants from Western Europe vs Immigrants from Bangladesh Vision Disability Correlation Chart
The statistical analysis conducted on geographies consisting of 493,396,041 people shows a near-perfect positive correlation between the proportion of Immigrants from Western Europe and percentage of population with vision disability in the United States with a correlation coefficient (R) of 0.922 and weighted average of 2.2%. Similarly, the statistical analysis conducted on geographies consisting of 203,575,590 people shows a poor positive correlation between the proportion of Immigrants from Bangladesh and percentage of population with vision disability in the United States with a correlation coefficient (R) of 0.144 and weighted average of 2.1%, a difference of 1.6%.
Vision Disability Correlation Summary
| Measurement | Immigrants from Western Europe | Immigrants from Bangladesh |
| Minimum | 1.2% | 0.53% |
| Maximum | 75.4% | 4.4% |
| Range | 74.2% | 3.8% |
| Mean | 7.0% | 2.1% |
| Median | 2.6% | 2.1% |
| Interquartile 25% (IQ1) | 1.9% | 1.7% |
| Interquartile 75% (IQ3) | 6.1% | 2.4% |
| Interquartile Range (IQR) | 4.2% | 0.70% |
| Standard Deviation (Sample) | 13.7% | 0.78% |
| Standard Deviation (Population) | 13.5% | 0.77% |
Demographics Similar to Immigrants from Western Europe and Immigrants from Bangladesh by Vision Disability
In terms of vision disability, the demographic groups most similar to Immigrants from Western Europe are Costa Rican (2.2%, a difference of 0.020%), Uruguayan (2.2%, a difference of 0.10%), Immigrants from North America (2.2%, a difference of 0.22%), Immigrants from Oceania (2.2%, a difference of 0.26%), and Slavic (2.2%, a difference of 0.31%). Similarly, the demographic groups most similar to Immigrants from Bangladesh are Icelander (2.1%, a difference of 0.040%), Immigrants from Iraq (2.1%, a difference of 0.050%), Hungarian (2.1%, a difference of 0.13%), Immigrants from England (2.1%, a difference of 0.19%), and Immigrants from Africa (2.1%, a difference of 0.20%).
| Demographics | Rating | Rank | Vision Disability |
| Hungarians | 67.4 /100 | #162 | Good 2.1% |
| Icelanders | 66.1 /100 | #163 | Good 2.1% |
| Immigrants | Bangladesh | 65.5 /100 | #164 | Good 2.1% |
| Immigrants | Iraq | 64.8 /100 | #165 | Good 2.1% |
| Immigrants | England | 62.8 /100 | #166 | Good 2.1% |
| Immigrants | Africa | 62.6 /100 | #167 | Good 2.1% |
| Brazilians | 62.2 /100 | #168 | Good 2.1% |
| South American Indians | 57.4 /100 | #169 | Average 2.2% |
| Swiss | 55.7 /100 | #170 | Average 2.2% |
| Lebanese | 54.3 /100 | #171 | Average 2.2% |
| Northern Europeans | 50.1 /100 | #172 | Average 2.2% |
| Scandinavians | 50.0 /100 | #173 | Average 2.2% |
| Immigrants | Canada | 50.0 /100 | #174 | Average 2.2% |
| Immigrants | Fiji | 47.6 /100 | #175 | Average 2.2% |
| Yugoslavians | 46.5 /100 | #176 | Average 2.2% |
| Slavs | 46.0 /100 | #177 | Average 2.2% |
| Immigrants | Oceania | 45.1 /100 | #178 | Average 2.2% |
| Immigrants | North America | 44.5 /100 | #179 | Average 2.2% |
| Uruguayans | 42.7 /100 | #180 | Average 2.2% |
| Immigrants | Western Europe | 41.1 /100 | #181 | Average 2.2% |
| Costa Ricans | 40.7 /100 | #182 | Average 2.2% |