Immigrants from Western Europe vs Armenian Male Disability

COMPARE

Immigrants from Western Europe
Race
Ancestry
AfghanAfricanAlaska NativeAlaskan AthabascanAlbanianAleutAlsatianAmericanApacheArabArapahoArgentineanAssyrian/Chaldean/SyriacAustralianAustrianBahamianBangladeshiBarbadianBasqueBelgianBelizeanBermudanBhutaneseBlackfeetBolivianBrazilianBritishBritish West IndianBulgarianBurmeseCajunCambodianCanadianCape VerdeanCarpatho RusynCelticCentral AmericanCentral American IndianCherokeeCheyenneChickasawChileanChineseChippewaChoctawColombianColvilleComancheCosta RicanCreeCreekCroatianCrowCubanCypriotCzechCzechoslovakianDanishDelawareDominicanDutchDutch West IndianEastern EuropeanEcuadorianEgyptianEnglishEstonianEthiopianEuropeanFijianFilipinoFinnishFrenchFrench American IndianFrench CanadianGermanGerman RussianGhanaianGreekGuamanian/ChamorroGuatemalanGuyaneseHaitianHmongHonduranHopiHoumaHungarianIcelanderIndian (Asian)IndonesianInupiatIranianIraqiIrishIroquoisIsraeliItalianJamaicanJapaneseJordanianKenyanKiowaKoreanLaotianLatvianLebaneseLiberianLithuanianLumbeeLuxembourgerMacedonianMalaysianMalteseMarshalleseMenomineeMexicanMexican American IndianMongolianMoroccanNative HawaiianNavajoNepaleseNew ZealanderNicaraguanNigerianNorthern EuropeanNorwegianOkinawanOsageOttawaPaiutePakistaniPalestinianPanamanianParaguayanPennsylvania GermanPeruvianPimaPolishPortuguesePotawatomiPuebloPuerto RicanPuget Sound SalishRomanianRussianSalvadoranSamoanScandinavianScotch-IrishScottishSeminoleSenegaleseSerbianShoshoneSierra LeoneanSiouxSlavicSlovakSloveneSomaliSouth AfricanSouth AmericanSouth American IndianSoviet UnionSpaniardSpanishSpanish AmericanSpanish American IndianSri LankanSubsaharan AfricanSudaneseSwedishSwissSyrianTaiwaneseThaiTlingit-HaidaTohono O'OdhamTonganTrinidadian and TobagonianTsimshianTurkishU.S. Virgin IslanderUgandanUkrainianUruguayanUteVenezuelanVietnameseWelshWest IndianYakamaYaquiYugoslavianYumanYup'ikZimbabwean
Immigration
NonimmigrantsImmigrantsAfghanistanAfricaAlbaniaArgentinaArmeniaAsiaAustraliaAustriaBahamasBangladeshBarbadosBelarusBelgiumBelizeBoliviaBosnia and HerzegovinaBrazilBulgariaBurma/MyanmarCabo VerdeCambodiaCameroonCanadaCaribbeanCentral AmericaChileChinaColombiaCongoCosta RicaCroatiaCubaCzechoslovakiaDenmarkDominicaDominican RepublicEastern AfricaEastern AsiaEastern EuropeEcuadorEgyptEl SalvadorEnglandEritreaEthiopiaEuropeFijiFranceGermanyGhanaGreeceGrenadaGuatemalaGuyanaHaitiHondurasHong KongHungaryIndiaIndonesiaIranIraqIrelandIsraelItalyJamaicaJapanJordanKazakhstanKenyaKoreaKuwaitLaosLatin AmericaLatviaLebanonLiberiaLithuaniaMalaysiaMexicoMicronesiaMiddle AfricaMoldovaMoroccoNepalNetherlandsNicaraguaNigeriaNorth AmericaNorth MacedoniaNorthern AfricaNorthern EuropeNorwayOceaniaPakistanPanamaPeruPhilippinesPolandPortugalRomaniaRussiaSaudi ArabiaScotlandSenegalSerbiaSierra LeoneSingaporeSomaliaSouth AfricaSouth AmericaSouth Central AsiaSouth Eastern AsiaSouthern EuropeSpainSri LankaSt. Vincent and the GrenadinesSudanSwedenSwitzerlandSyriaTaiwanThailandTrinidad and TobagoTurkeyUgandaUkraineUruguayUzbekistanVenezuelaVietnamWest IndiesWestern AfricaWestern AsiaWestern EuropeYemenZaireZimbabweAzores
Armenian
Race
Ancestry
AfghanAfricanAlaska NativeAlaskan AthabascanAlbanianAleutAlsatianAmericanApacheArabArapahoArgentineanArmenianAssyrian/Chaldean/SyriacAustralianAustrianBahamianBangladeshiBarbadianBasqueBelgianBelizeanBermudanBhutaneseBlackfeetBolivianBrazilianBritishBritish West IndianBulgarianBurmeseCajunCambodianCanadianCape VerdeanCarpatho RusynCelticCentral AmericanCentral American IndianCherokeeCheyenneChickasawChileanChineseChippewaChoctawColombianColvilleComancheCosta RicanCreeCreekCroatianCrowCubanCypriotCzechCzechoslovakianDanishDelawareDominicanDutchDutch West IndianEastern EuropeanEcuadorianEgyptianEnglishEstonianEthiopianEuropeanFijianFilipinoFinnishFrenchFrench American IndianFrench CanadianGermanGerman RussianGhanaianGreekGuamanian/ChamorroGuatemalanGuyaneseHaitianHmongHonduranHopiHoumaHungarianIcelanderIndian (Asian)IndonesianInupiatIranianIraqiIrishIroquoisIsraeliItalianJamaicanJapaneseJordanianKenyanKiowaKoreanLaotianLatvianLebaneseLiberianLithuanianLumbeeLuxembourgerMacedonianMalaysianMalteseMarshalleseMenomineeMexicanMexican American IndianMongolianMoroccanNative HawaiianNavajoNepaleseNew ZealanderNicaraguanNigerianNorthern EuropeanNorwegianOkinawanOsageOttawaPaiutePakistaniPalestinianPanamanianParaguayanPennsylvania GermanPeruvianPimaPolishPortuguesePotawatomiPuebloPuerto RicanPuget Sound SalishRomanianRussianSalvadoranSamoanScandinavianScotch-IrishScottishSeminoleSenegaleseSerbianShoshoneSierra LeoneanSiouxSlavicSlovakSloveneSomaliSouth AfricanSouth AmericanSouth American IndianSoviet UnionSpaniardSpanishSpanish AmericanSpanish American IndianSri LankanSubsaharan AfricanSudaneseSwedishSwissSyrianTaiwaneseThaiTlingit-HaidaTohono O'OdhamTonganTrinidadian and TobagonianTsimshianTurkishU.S. Virgin IslanderUgandanUkrainianUruguayanUteVenezuelanVietnameseWelshWest IndianYakamaYaquiYugoslavianYumanYup'ikZimbabwean
Immigration
NonimmigrantsImmigrantsAfghanistanAfricaAlbaniaArgentinaArmeniaAsiaAustraliaAustriaBahamasBangladeshBarbadosBelarusBelgiumBelizeBoliviaBosnia and HerzegovinaBrazilBulgariaBurma/MyanmarCabo VerdeCambodiaCameroonCanadaCaribbeanCentral AmericaChileChinaColombiaCongoCosta RicaCroatiaCubaCzechoslovakiaDenmarkDominicaDominican RepublicEastern AfricaEastern AsiaEastern EuropeEcuadorEgyptEl SalvadorEnglandEritreaEthiopiaEuropeFijiFranceGermanyGhanaGreeceGrenadaGuatemalaGuyanaHaitiHondurasHong KongHungaryIndiaIndonesiaIranIraqIrelandIsraelItalyJamaicaJapanJordanKazakhstanKenyaKoreaKuwaitLaosLatin AmericaLatviaLebanonLiberiaLithuaniaMalaysiaMexicoMicronesiaMiddle AfricaMoldovaMoroccoNepalNetherlandsNicaraguaNigeriaNorth AmericaNorth MacedoniaNorthern AfricaNorthern EuropeNorwayOceaniaPakistanPanamaPeruPhilippinesPolandPortugalRomaniaRussiaSaudi ArabiaScotlandSenegalSerbiaSierra LeoneSingaporeSomaliaSouth AfricaSouth AmericaSouth Central AsiaSouth Eastern AsiaSouthern EuropeSpainSri LankaSt. Vincent and the GrenadinesSudanSwedenSwitzerlandSyriaTaiwanThailandTrinidad and TobagoTurkeyUgandaUkraineUruguayUzbekistanVenezuelaVietnamWest IndiesWestern AfricaWestern AsiaYemenZaireZimbabweAzores
Male Disability
Income
Poverty
Unemployment
Labor Participation
Family Structure
Vehicle Availability
Education Level
Disability

Male Disability Comparison

Immigrants from Western Europe

Armenians

Tragic
Exceptional
11.7%
MALE DISABILITY
3.8/ 100
METRIC RATING
220th/ 347
METRIC RANK
10.9%
MALE DISABILITY
90.1/ 100
METRIC RATING
119th/ 347
METRIC RANK

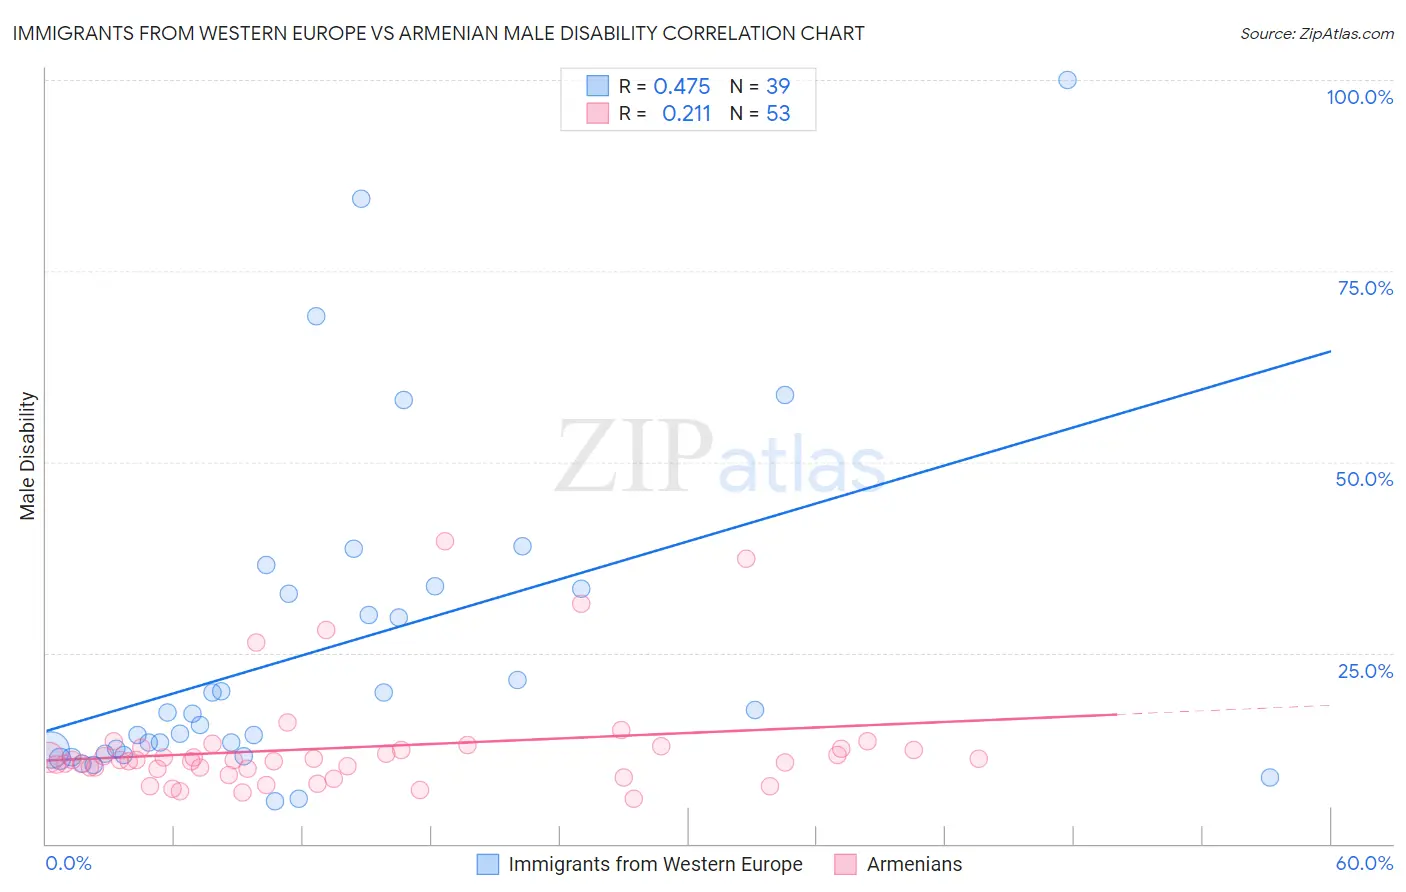
Immigrants from Western Europe vs Armenian Male Disability Correlation Chart

The statistical analysis conducted on geographies consisting of 494,010,238 people shows a moderate positive correlation between the proportion of Immigrants from Western Europe and percentage of males with a disability in the United States with a correlation coefficient (R) of 0.475 and weighted average of 11.7%. Similarly, the statistical analysis conducted on geographies consisting of 310,935,908 people shows a weak positive correlation between the proportion of Armenians and percentage of males with a disability in the United States with a correlation coefficient (R) of 0.211 and weighted average of 10.9%, a difference of 7.8%.
Immigrants from Western Europe vs Armenian Male Disability

Male Disability Correlation Summary

MeasurementImmigrants from Western EuropeArmenian
Minimum5.5%5.9%
Maximum100.0%39.5%
Range94.5%33.7%
Mean25.6%12.6%
Median17.1%10.9%
Interquartile 25% (IQ1)11.8%9.8%
Interquartile 75% (IQ3)33.3%12.5%
Interquartile Range (IQR)21.6%2.8%
Standard Deviation (Sample)21.7%7.0%
Standard Deviation (Population)21.4%6.9%

Similar Demographics by Male Disability

Demographics Similar to Immigrants from Western Europe by Male Disability

In terms of male disability, the demographic groups most similar to Immigrants from Western Europe are Panamanian (11.7%, a difference of 0.010%), Immigrants from Congo (11.7%, a difference of 0.010%), Immigrants from England (11.7%, a difference of 0.070%), Alsatian (11.7%, a difference of 0.17%), and Immigrants from Bahamas (11.7%, a difference of 0.25%).
DemographicsRating | RankMale Disability
Mexican American Indians
7.8
/100
|
#213
Tragic
11.6%
Lithuanians
6.6
/100
|
#214
Tragic
11.6%
Indonesians
5.9
/100
|
#215
Tragic
11.6%
Immigrants | Dominican Republic
4.9
/100
|
#216
Tragic
11.7%
Immigrants | Dominica
4.6
/100
|
#217
Tragic
11.7%
Immigrants | England
4.0
/100
|
#218
Tragic
11.7%
Panamanians
3.8
/100
|
#219
Tragic
11.7%
Immigrants | Western Europe
3.8
/100
|
#220
Tragic
11.7%
Immigrants | Congo
3.7
/100
|
#221
Tragic
11.7%
Alsatians
3.3
/100
|
#222
Tragic
11.7%
Immigrants | Bahamas
3.2
/100
|
#223
Tragic
11.7%
Japanese
3.1
/100
|
#224
Tragic
11.7%
Liberians
3.1
/100
|
#225
Tragic
11.8%
Sub-Saharan Africans
2.8
/100
|
#226
Tragic
11.8%
Austrians
2.5
/100
|
#227
Tragic
11.8%

Demographics Similar to Armenians by Male Disability

In terms of male disability, the demographic groups most similar to Armenians are Immigrants from Cuba (10.9%, a difference of 0.0%), Eastern European (10.9%, a difference of 0.080%), Immigrants from Africa (10.9%, a difference of 0.11%), Immigrants from South Eastern Asia (10.9%, a difference of 0.15%), and Immigrants from Ghana (10.9%, a difference of 0.17%).
DemographicsRating | RankMale Disability
Ghanaians
93.4
/100
|
#112
Exceptional
10.8%
Immigrants | Zimbabwe
93.0
/100
|
#113
Exceptional
10.8%
Central Americans
92.7
/100
|
#114
Exceptional
10.8%
Immigrants | Barbados
92.2
/100
|
#115
Exceptional
10.8%
Immigrants | South Africa
91.8
/100
|
#116
Exceptional
10.8%
Eastern Europeans
90.6
/100
|
#117
Exceptional
10.9%
Immigrants | Cuba
90.2
/100
|
#118
Exceptional
10.9%
Armenians
90.1
/100
|
#119
Exceptional
10.9%
Immigrants | Africa
89.4
/100
|
#120
Excellent
10.9%
Immigrants | South Eastern Asia
89.2
/100
|
#121
Excellent
10.9%
Immigrants | Ghana
89.0
/100
|
#122
Excellent
10.9%
Immigrants | Czechoslovakia
88.4
/100
|
#123
Excellent
10.9%
South American Indians
88.1
/100
|
#124
Excellent
10.9%
Immigrants | North Macedonia
88.1
/100
|
#125
Excellent
10.9%
Immigrants | Trinidad and Tobago
86.9
/100
|
#126
Excellent
10.9%