Immigrants from Western Europe vs Armenian Unemployment Among Seniors over 65 years

COMPARE

Immigrants from Western Europe
Race
Ancestry
AfghanAfricanAlaska NativeAlaskan AthabascanAlbanianAleutAlsatianAmericanApacheArabArapahoArgentineanAssyrian/Chaldean/SyriacAustralianAustrianBahamianBangladeshiBarbadianBasqueBelgianBelizeanBermudanBhutaneseBlackfeetBolivianBrazilianBritishBritish West IndianBulgarianBurmeseCajunCambodianCanadianCape VerdeanCarpatho RusynCelticCentral AmericanCentral American IndianCherokeeCheyenneChickasawChileanChineseChippewaChoctawColombianColvilleComancheCosta RicanCreeCreekCroatianCrowCubanCypriotCzechCzechoslovakianDanishDelawareDominicanDutchDutch West IndianEastern EuropeanEcuadorianEgyptianEnglishEstonianEthiopianEuropeanFijianFilipinoFinnishFrenchFrench American IndianFrench CanadianGermanGerman RussianGhanaianGreekGuamanian/ChamorroGuatemalanGuyaneseHaitianHmongHonduranHopiHoumaHungarianIcelanderIndian (Asian)IndonesianInupiatIranianIraqiIrishIroquoisIsraeliItalianJamaicanJapaneseJordanianKenyanKiowaKoreanLaotianLatvianLebaneseLiberianLithuanianLumbeeLuxembourgerMacedonianMalaysianMalteseMarshalleseMenomineeMexicanMexican American IndianMongolianMoroccanNative HawaiianNavajoNepaleseNew ZealanderNicaraguanNigerianNorthern EuropeanNorwegianOkinawanOsageOttawaPaiutePakistaniPalestinianPanamanianParaguayanPennsylvania GermanPeruvianPimaPolishPortuguesePotawatomiPuebloPuerto RicanPuget Sound SalishRomanianRussianSalvadoranSamoanScandinavianScotch-IrishScottishSeminoleSenegaleseSerbianShoshoneSierra LeoneanSiouxSlavicSlovakSloveneSomaliSouth AfricanSouth AmericanSouth American IndianSoviet UnionSpaniardSpanishSpanish AmericanSpanish American IndianSri LankanSubsaharan AfricanSudaneseSwedishSwissSyrianTaiwaneseThaiTlingit-HaidaTohono O'OdhamTonganTrinidadian and TobagonianTsimshianTurkishU.S. Virgin IslanderUgandanUkrainianUruguayanUteVenezuelanVietnameseWelshWest IndianYakamaYaquiYugoslavianYumanYup'ikZimbabwean
Immigration
NonimmigrantsImmigrantsAfghanistanAfricaAlbaniaArgentinaArmeniaAsiaAustraliaAustriaBahamasBangladeshBarbadosBelarusBelgiumBelizeBoliviaBosnia and HerzegovinaBrazilBulgariaBurma/MyanmarCabo VerdeCambodiaCameroonCanadaCaribbeanCentral AmericaChileChinaColombiaCongoCosta RicaCroatiaCubaCzechoslovakiaDenmarkDominicaDominican RepublicEastern AfricaEastern AsiaEastern EuropeEcuadorEgyptEl SalvadorEnglandEritreaEthiopiaEuropeFijiFranceGermanyGhanaGreeceGrenadaGuatemalaGuyanaHaitiHondurasHong KongHungaryIndiaIndonesiaIranIraqIrelandIsraelItalyJamaicaJapanJordanKazakhstanKenyaKoreaKuwaitLaosLatin AmericaLatviaLebanonLiberiaLithuaniaMalaysiaMexicoMicronesiaMiddle AfricaMoldovaMoroccoNepalNetherlandsNicaraguaNigeriaNorth AmericaNorth MacedoniaNorthern AfricaNorthern EuropeNorwayOceaniaPakistanPanamaPeruPhilippinesPolandPortugalRomaniaRussiaSaudi ArabiaScotlandSenegalSerbiaSierra LeoneSingaporeSomaliaSouth AfricaSouth AmericaSouth Central AsiaSouth Eastern AsiaSouthern EuropeSpainSri LankaSt. Vincent and the GrenadinesSudanSwedenSwitzerlandSyriaTaiwanThailandTrinidad and TobagoTurkeyUgandaUkraineUruguayUzbekistanVenezuelaVietnamWest IndiesWestern AfricaWestern AsiaWestern EuropeYemenZaireZimbabweAzores
Armenian
Race
Ancestry
AfghanAfricanAlaska NativeAlaskan AthabascanAlbanianAleutAlsatianAmericanApacheArabArapahoArgentineanArmenianAssyrian/Chaldean/SyriacAustralianAustrianBahamianBangladeshiBarbadianBasqueBelgianBelizeanBermudanBhutaneseBlackfeetBolivianBrazilianBritishBritish West IndianBulgarianBurmeseCajunCambodianCanadianCape VerdeanCarpatho RusynCelticCentral AmericanCentral American IndianCherokeeCheyenneChickasawChileanChineseChippewaChoctawColombianColvilleComancheCosta RicanCreeCreekCroatianCrowCubanCypriotCzechCzechoslovakianDanishDelawareDominicanDutchDutch West IndianEastern EuropeanEcuadorianEgyptianEnglishEstonianEthiopianEuropeanFijianFilipinoFinnishFrenchFrench American IndianFrench CanadianGermanGerman RussianGhanaianGreekGuamanian/ChamorroGuatemalanGuyaneseHaitianHmongHonduranHopiHoumaHungarianIcelanderIndian (Asian)IndonesianInupiatIranianIraqiIrishIroquoisIsraeliItalianJamaicanJapaneseJordanianKenyanKiowaKoreanLaotianLatvianLebaneseLiberianLithuanianLumbeeLuxembourgerMacedonianMalaysianMalteseMarshalleseMenomineeMexicanMexican American IndianMongolianMoroccanNative HawaiianNavajoNepaleseNew ZealanderNicaraguanNigerianNorthern EuropeanNorwegianOkinawanOsageOttawaPaiutePakistaniPalestinianPanamanianParaguayanPennsylvania GermanPeruvianPimaPolishPortuguesePotawatomiPuebloPuerto RicanPuget Sound SalishRomanianRussianSalvadoranSamoanScandinavianScotch-IrishScottishSeminoleSenegaleseSerbianShoshoneSierra LeoneanSiouxSlavicSlovakSloveneSomaliSouth AfricanSouth AmericanSouth American IndianSoviet UnionSpaniardSpanishSpanish AmericanSpanish American IndianSri LankanSubsaharan AfricanSudaneseSwedishSwissSyrianTaiwaneseThaiTlingit-HaidaTohono O'OdhamTonganTrinidadian and TobagonianTsimshianTurkishU.S. Virgin IslanderUgandanUkrainianUruguayanUteVenezuelanVietnameseWelshWest IndianYakamaYaquiYugoslavianYumanYup'ikZimbabwean
Immigration
NonimmigrantsImmigrantsAfghanistanAfricaAlbaniaArgentinaArmeniaAsiaAustraliaAustriaBahamasBangladeshBarbadosBelarusBelgiumBelizeBoliviaBosnia and HerzegovinaBrazilBulgariaBurma/MyanmarCabo VerdeCambodiaCameroonCanadaCaribbeanCentral AmericaChileChinaColombiaCongoCosta RicaCroatiaCubaCzechoslovakiaDenmarkDominicaDominican RepublicEastern AfricaEastern AsiaEastern EuropeEcuadorEgyptEl SalvadorEnglandEritreaEthiopiaEuropeFijiFranceGermanyGhanaGreeceGrenadaGuatemalaGuyanaHaitiHondurasHong KongHungaryIndiaIndonesiaIranIraqIrelandIsraelItalyJamaicaJapanJordanKazakhstanKenyaKoreaKuwaitLaosLatin AmericaLatviaLebanonLiberiaLithuaniaMalaysiaMexicoMicronesiaMiddle AfricaMoldovaMoroccoNepalNetherlandsNicaraguaNigeriaNorth AmericaNorth MacedoniaNorthern AfricaNorthern EuropeNorwayOceaniaPakistanPanamaPeruPhilippinesPolandPortugalRomaniaRussiaSaudi ArabiaScotlandSenegalSerbiaSierra LeoneSingaporeSomaliaSouth AfricaSouth AmericaSouth Central AsiaSouth Eastern AsiaSouthern EuropeSpainSri LankaSt. Vincent and the GrenadinesSudanSwedenSwitzerlandSyriaTaiwanThailandTrinidad and TobagoTurkeyUgandaUkraineUruguayUzbekistanVenezuelaVietnamWest IndiesWestern AfricaWestern AsiaYemenZaireZimbabweAzores
Unemployment Among Seniors over 65 years
Income
Poverty
Unemployment
Labor Participation
Family Structure
Vehicle Availability
Education Level
Disability

Unemployment Among Seniors over 65 years Comparison

Immigrants from Western Europe

Armenians

Good
Tragic
5.1%
UNEMPLOYMENT AMONG SENIORS OVER 65 YEARS
60.4/ 100
METRIC RATING
167th/ 347
METRIC RANK
5.5%
UNEMPLOYMENT AMONG SENIORS OVER 65 YEARS
0.0/ 100
METRIC RATING
294th/ 347
METRIC RANK

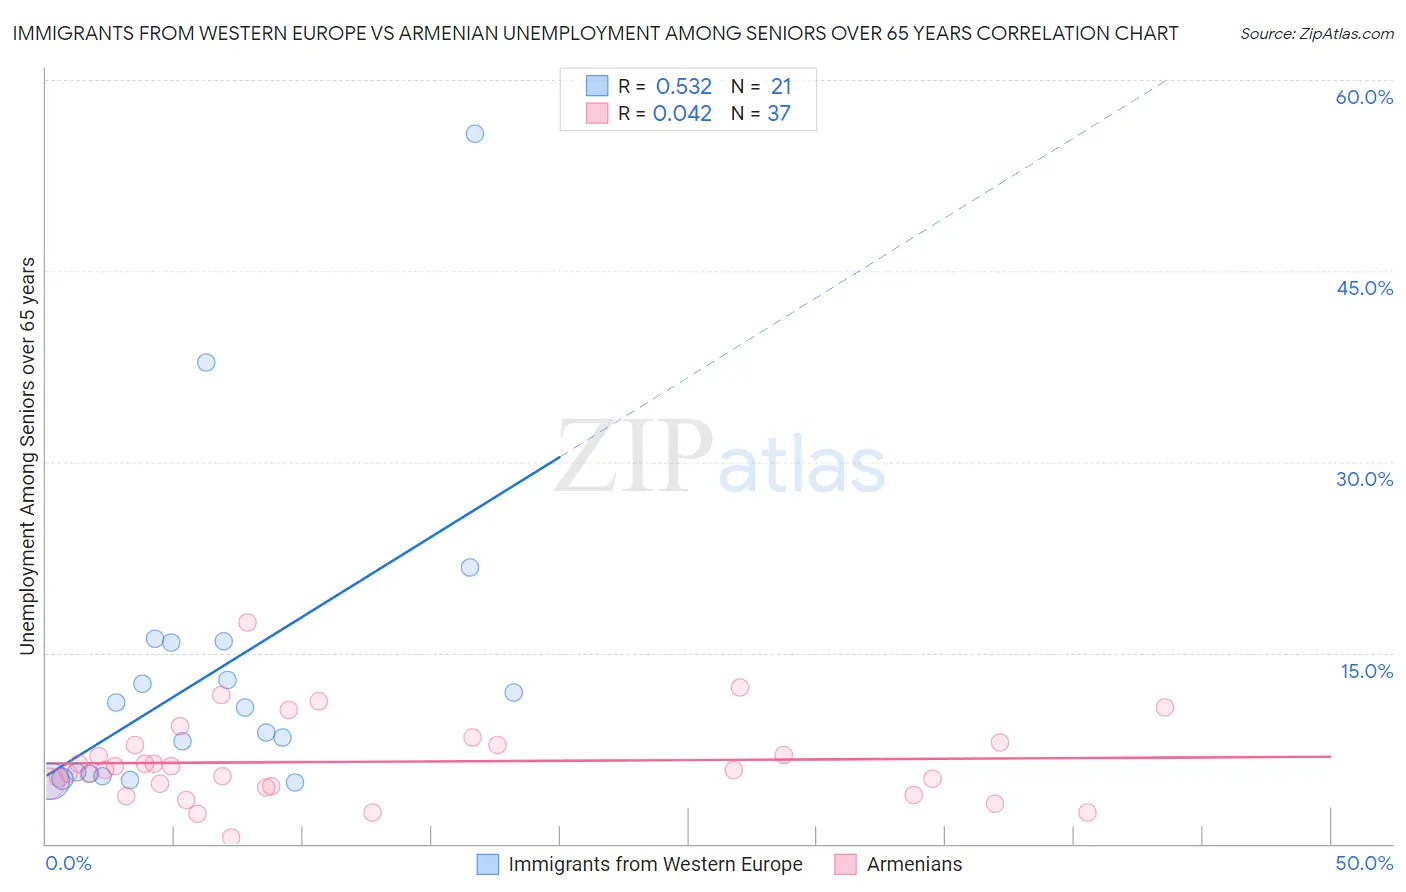
Immigrants from Western Europe vs Armenian Unemployment Among Seniors over 65 years Correlation Chart

The statistical analysis conducted on geographies consisting of 426,396,427 people shows a substantial positive correlation between the proportion of Immigrants from Western Europe and unemployment rate amomg seniors over the age of 65 in the United States with a correlation coefficient (R) of 0.532 and weighted average of 5.1%. Similarly, the statistical analysis conducted on geographies consisting of 288,828,346 people shows no correlation between the proportion of Armenians and unemployment rate amomg seniors over the age of 65 in the United States with a correlation coefficient (R) of 0.042 and weighted average of 5.5%, a difference of 8.0%.
Immigrants from Western Europe vs Armenian Unemployment Among Seniors over 65 years

Unemployment Among Seniors over 65 years Correlation Summary

MeasurementImmigrants from Western EuropeArmenian
Minimum4.9%0.50%
Maximum55.8%17.4%
Range50.9%16.9%
Mean13.5%6.4%
Median10.7%5.8%
Interquartile 25% (IQ1)5.4%4.5%
Interquartile 75% (IQ3)15.9%7.9%
Interquartile Range (IQR)10.4%3.4%
Standard Deviation (Sample)12.3%3.3%
Standard Deviation (Population)12.0%3.3%

Similar Demographics by Unemployment Among Seniors over 65 years

Demographics Similar to Immigrants from Western Europe by Unemployment Among Seniors over 65 years

In terms of unemployment among seniors over 65 years, the demographic groups most similar to Immigrants from Western Europe are Mongolian (5.1%, a difference of 0.020%), Lithuanian (5.1%, a difference of 0.070%), Immigrants from Laos (5.1%, a difference of 0.12%), Immigrants from Ukraine (5.1%, a difference of 0.13%), and Potawatomi (5.1%, a difference of 0.14%).
DemographicsRating | RankUnemployment Among Seniors over 65 years
French
68.1
/100
|
#160
Good
5.1%
Immigrants | Bosnia and Herzegovina
66.1
/100
|
#161
Good
5.1%
Immigrants | South Eastern Asia
65.6
/100
|
#162
Good
5.1%
Potawatomi
64.5
/100
|
#163
Good
5.1%
Nepalese
64.5
/100
|
#164
Good
5.1%
Immigrants | Ukraine
64.2
/100
|
#165
Good
5.1%
Immigrants | Laos
63.8
/100
|
#166
Good
5.1%
Immigrants | Western Europe
60.4
/100
|
#167
Good
5.1%
Mongolians
59.8
/100
|
#168
Average
5.1%
Lithuanians
58.2
/100
|
#169
Average
5.1%
Immigrants | Eastern Asia
54.9
/100
|
#170
Average
5.1%
Immigrants | Nonimmigrants
54.1
/100
|
#171
Average
5.1%
Immigrants | Ireland
53.2
/100
|
#172
Average
5.1%
Immigrants | Spain
51.7
/100
|
#173
Average
5.1%
Spanish Americans
50.0
/100
|
#174
Average
5.1%

Demographics Similar to Armenians by Unemployment Among Seniors over 65 years

In terms of unemployment among seniors over 65 years, the demographic groups most similar to Armenians are Immigrants from Venezuela (5.5%, a difference of 0.040%), Cheyenne (5.5%, a difference of 0.070%), Belizean (5.5%, a difference of 0.080%), Cape Verdean (5.5%, a difference of 0.080%), and Yaqui (5.5%, a difference of 0.090%).
DemographicsRating | RankUnemployment Among Seniors over 65 years
Venezuelans
0.0
/100
|
#287
Tragic
5.5%
U.S. Virgin Islanders
0.0
/100
|
#288
Tragic
5.5%
Immigrants | Cabo Verde
0.0
/100
|
#289
Tragic
5.5%
Jamaicans
0.0
/100
|
#290
Tragic
5.5%
Blacks/African Americans
0.0
/100
|
#291
Tragic
5.5%
Belizeans
0.0
/100
|
#292
Tragic
5.5%
Immigrants | Venezuela
0.0
/100
|
#293
Tragic
5.5%
Armenians
0.0
/100
|
#294
Tragic
5.5%
Cheyenne
0.0
/100
|
#295
Tragic
5.5%
Cape Verdeans
0.0
/100
|
#296
Tragic
5.5%
Yaqui
0.0
/100
|
#297
Tragic
5.5%
Immigrants | West Indies
0.0
/100
|
#298
Tragic
5.6%
Guyanese
0.0
/100
|
#299
Tragic
5.6%
Zimbabweans
0.0
/100
|
#300
Tragic
5.6%
Hispanics or Latinos
0.0
/100
|
#301
Tragic
5.6%