Immigrants from Western Africa vs U.S. Virgin Islander Cognitive Disability
COMPARE
Immigrants from Western Africa
U.S. Virgin Islander
Cognitive Disability
Cognitive Disability Comparison
Immigrants from Western Africa
U.S. Virgin Islanders
18.4%
COGNITIVE DISABILITY
0.0/ 100
METRIC RATING
308th/ 347
METRIC RANK
18.7%
COGNITIVE DISABILITY
0.0/ 100
METRIC RATING
327th/ 347
METRIC RANK
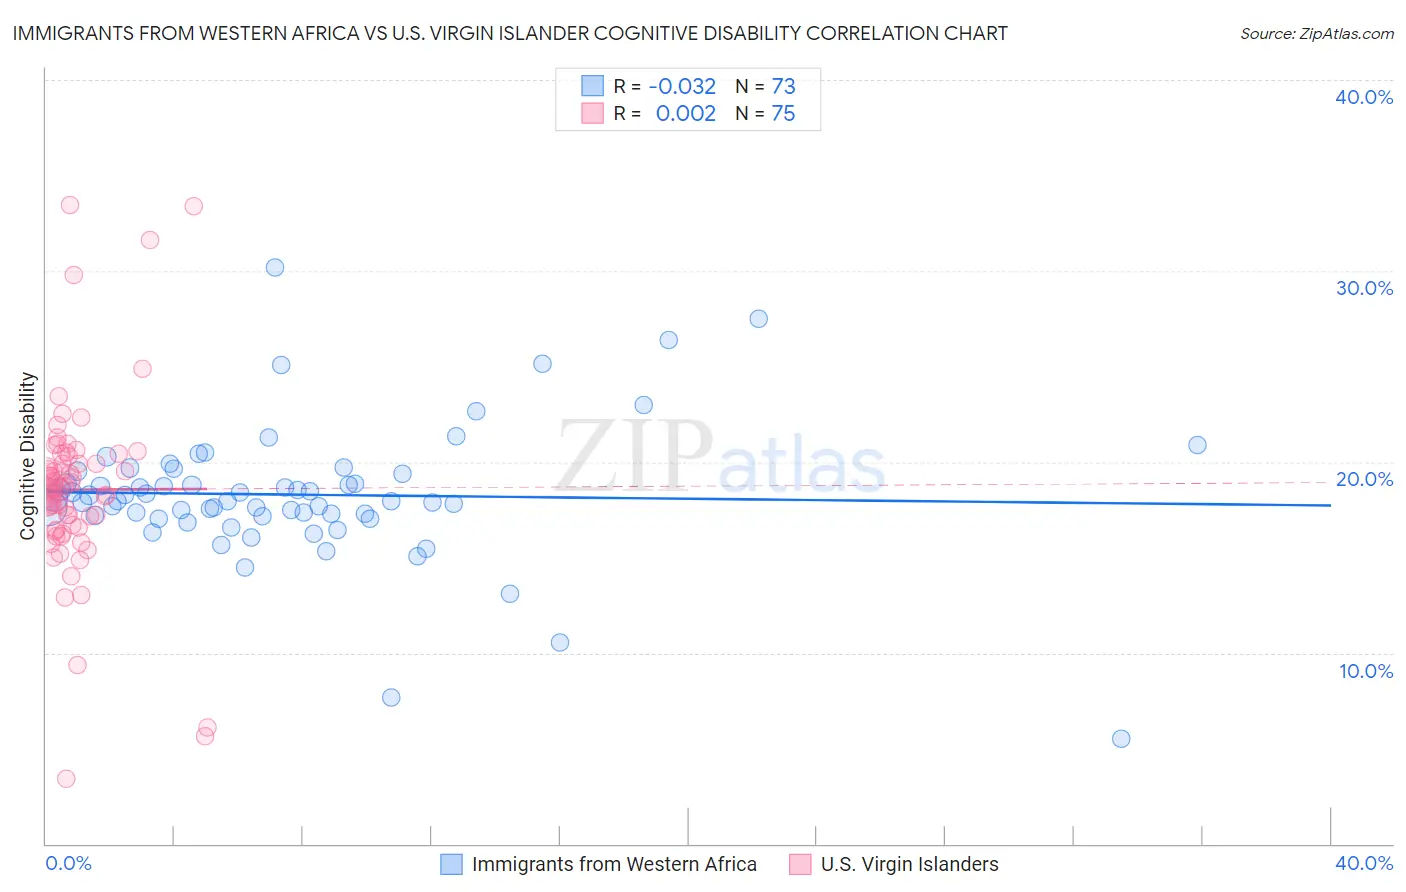
Immigrants from Western Africa vs U.S. Virgin Islander Cognitive Disability Correlation Chart
The statistical analysis conducted on geographies consisting of 357,804,343 people shows no correlation between the proportion of Immigrants from Western Africa and percentage of population with cognitive disability in the United States with a correlation coefficient (R) of -0.032 and weighted average of 18.4%. Similarly, the statistical analysis conducted on geographies consisting of 87,523,462 people shows no correlation between the proportion of U.S. Virgin Islanders and percentage of population with cognitive disability in the United States with a correlation coefficient (R) of 0.002 and weighted average of 18.7%, a difference of 1.9%.
Cognitive Disability Correlation Summary
| Measurement | Immigrants from Western Africa | U.S. Virgin Islander |
| Minimum | 5.5% | 3.4% |
| Maximum | 30.2% | 33.5% |
| Range | 24.6% | 30.0% |
| Mean | 18.3% | 18.5% |
| Median | 17.9% | 18.6% |
| Interquartile 25% (IQ1) | 17.2% | 16.6% |
| Interquartile 75% (IQ3) | 19.5% | 20.3% |
| Interquartile Range (IQR) | 2.3% | 3.7% |
| Standard Deviation (Sample) | 3.6% | 4.8% |
| Standard Deviation (Population) | 3.6% | 4.8% |
Demographics Similar to Immigrants from Western Africa and U.S. Virgin Islanders by Cognitive Disability
In terms of cognitive disability, the demographic groups most similar to Immigrants from Western Africa are Immigrants from Eastern Africa (18.4%, a difference of 0.040%), Ugandan (18.3%, a difference of 0.090%), Choctaw (18.4%, a difference of 0.41%), Hmong (18.4%, a difference of 0.44%), and Chickasaw (18.5%, a difference of 0.72%). Similarly, the demographic groups most similar to U.S. Virgin Islanders are Immigrants from Senegal (18.7%, a difference of 0.040%), Indonesian (18.7%, a difference of 0.060%), Dominican (18.7%, a difference of 0.14%), Pueblo (18.7%, a difference of 0.26%), and Immigrants from Liberia (18.7%, a difference of 0.27%).
| Demographics | Rating | Rank | Cognitive Disability |
| Ugandans | 0.0 /100 | #307 | Tragic 18.3% |
| Immigrants | Western Africa | 0.0 /100 | #308 | Tragic 18.4% |
| Immigrants | Eastern Africa | 0.0 /100 | #309 | Tragic 18.4% |
| Choctaw | 0.0 /100 | #310 | Tragic 18.4% |
| Hmong | 0.0 /100 | #311 | Tragic 18.4% |
| Chickasaw | 0.0 /100 | #312 | Tragic 18.5% |
| Yaqui | 0.0 /100 | #313 | Tragic 18.5% |
| Sub-Saharan Africans | 0.0 /100 | #314 | Tragic 18.5% |
| Immigrants | Dominica | 0.0 /100 | #315 | Tragic 18.6% |
| Immigrants | Middle Africa | 0.0 /100 | #316 | Tragic 18.6% |
| Liberians | 0.0 /100 | #317 | Tragic 18.6% |
| Bangladeshis | 0.0 /100 | #318 | Tragic 18.6% |
| Comanche | 0.0 /100 | #319 | Tragic 18.6% |
| Apache | 0.0 /100 | #320 | Tragic 18.6% |
| Africans | 0.0 /100 | #321 | Tragic 18.6% |
| Immigrants | Liberia | 0.0 /100 | #322 | Tragic 18.7% |
| Pueblo | 0.0 /100 | #323 | Tragic 18.7% |
| Dominicans | 0.0 /100 | #324 | Tragic 18.7% |
| Indonesians | 0.0 /100 | #325 | Tragic 18.7% |
| Immigrants | Senegal | 0.0 /100 | #326 | Tragic 18.7% |
| U.S. Virgin Islanders | 0.0 /100 | #327 | Tragic 18.7% |