Dominican vs Scotch-Irish Disability Age 65 to 74
COMPARE
Dominican
Scotch-Irish
Disability Age 65 to 74
Disability Age 65 to 74 Comparison
Dominicans
Scotch-Irish
26.7%
DISABILITY AGE 65 TO 74
0.0/ 100
METRIC RATING
294th/ 347
METRIC RANK
24.4%
DISABILITY AGE 65 TO 74
3.8/ 100
METRIC RATING
235th/ 347
METRIC RANK
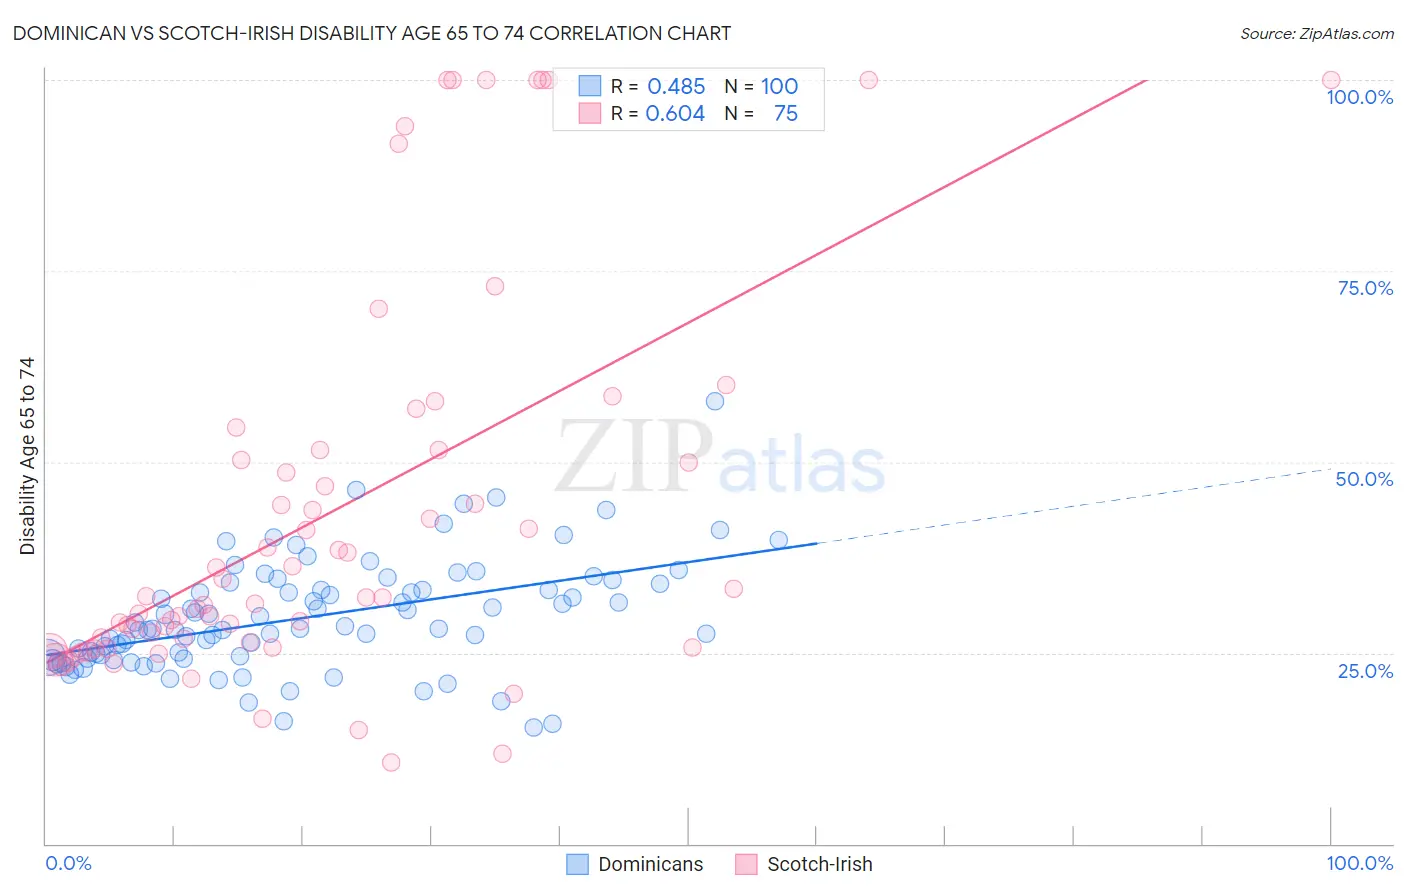
Dominican vs Scotch-Irish Disability Age 65 to 74 Correlation Chart
The statistical analysis conducted on geographies consisting of 354,107,357 people shows a moderate positive correlation between the proportion of Dominicans and percentage of population with a disability between the ages 65 and 75 in the United States with a correlation coefficient (R) of 0.485 and weighted average of 26.7%. Similarly, the statistical analysis conducted on geographies consisting of 546,992,221 people shows a significant positive correlation between the proportion of Scotch-Irish and percentage of population with a disability between the ages 65 and 75 in the United States with a correlation coefficient (R) of 0.604 and weighted average of 24.4%, a difference of 9.1%.
Disability Age 65 to 74 Correlation Summary
| Measurement | Dominican | Scotch-Irish |
| Minimum | 15.3% | 10.7% |
| Maximum | 57.9% | 100.0% |
| Range | 42.6% | 89.3% |
| Mean | 29.6% | 43.1% |
| Median | 28.1% | 32.3% |
| Interquartile 25% (IQ1) | 24.3% | 25.8% |
| Interquartile 75% (IQ3) | 33.6% | 51.5% |
| Interquartile Range (IQR) | 9.4% | 25.7% |
| Standard Deviation (Sample) | 7.3% | 25.2% |
| Standard Deviation (Population) | 7.2% | 25.0% |
Similar Demographics by Disability Age 65 to 74
Demographics Similar to Dominicans by Disability Age 65 to 74
In terms of disability age 65 to 74, the demographic groups most similar to Dominicans are Hispanic or Latino (26.7%, a difference of 0.020%), Immigrants from Central America (26.6%, a difference of 0.11%), Blackfeet (26.6%, a difference of 0.28%), Bangladeshi (26.8%, a difference of 0.63%), and Spanish American Indian (26.4%, a difference of 1.2%).
| Demographics | Rating | Rank | Disability Age 65 to 74 |
| Immigrants | Laos | 0.0 /100 | #287 | Tragic 26.1% |
| Mexican American Indians | 0.0 /100 | #288 | Tragic 26.2% |
| Africans | 0.0 /100 | #289 | Tragic 26.2% |
| Immigrants | Cabo Verde | 0.0 /100 | #290 | Tragic 26.3% |
| Spanish American Indians | 0.0 /100 | #291 | Tragic 26.4% |
| Blackfeet | 0.0 /100 | #292 | Tragic 26.6% |
| Immigrants | Central America | 0.0 /100 | #293 | Tragic 26.6% |
| Dominicans | 0.0 /100 | #294 | Tragic 26.7% |
| Hispanics or Latinos | 0.0 /100 | #295 | Tragic 26.7% |
| Bangladeshis | 0.0 /100 | #296 | Tragic 26.8% |
| Fijians | 0.0 /100 | #297 | Tragic 27.0% |
| Immigrants | Yemen | 0.0 /100 | #298 | Tragic 27.0% |
| Potawatomi | 0.0 /100 | #299 | Tragic 27.0% |
| Immigrants | Dominican Republic | 0.0 /100 | #300 | Tragic 27.0% |
| Immigrants | Mexico | 0.0 /100 | #301 | Tragic 27.1% |
Demographics Similar to Scotch-Irish by Disability Age 65 to 74
In terms of disability age 65 to 74, the demographic groups most similar to Scotch-Irish are German Russian (24.4%, a difference of 0.040%), West Indian (24.5%, a difference of 0.14%), Panamanian (24.4%, a difference of 0.16%), Bahamian (24.4%, a difference of 0.26%), and Immigrants from Ghana (24.5%, a difference of 0.31%).
| Demographics | Rating | Rank | Disability Age 65 to 74 |
| Whites/Caucasians | 6.6 /100 | #228 | Tragic 24.2% |
| Celtics | 6.4 /100 | #229 | Tragic 24.2% |
| Barbadians | 6.0 /100 | #230 | Tragic 24.3% |
| Immigrants | Thailand | 5.2 /100 | #231 | Tragic 24.3% |
| Immigrants | Zaire | 5.0 /100 | #232 | Tragic 24.3% |
| Bahamians | 4.5 /100 | #233 | Tragic 24.4% |
| Panamanians | 4.2 /100 | #234 | Tragic 24.4% |
| Scotch-Irish | 3.8 /100 | #235 | Tragic 24.4% |
| German Russians | 3.7 /100 | #236 | Tragic 24.4% |
| West Indians | 3.4 /100 | #237 | Tragic 24.5% |
| Immigrants | Ghana | 3.0 /100 | #238 | Tragic 24.5% |
| Immigrants | Caribbean | 2.6 /100 | #239 | Tragic 24.6% |
| Spaniards | 2.4 /100 | #240 | Tragic 24.6% |
| Immigrants | Western Africa | 2.3 /100 | #241 | Tragic 24.6% |
| Immigrants | Senegal | 2.2 /100 | #242 | Tragic 24.6% |