Immigrants from Venezuela vs French Canadian Hearing Disability
COMPARE
Immigrants from Venezuela
French Canadian
Hearing Disability
Hearing Disability Comparison
Immigrants from Venezuela
French Canadians
2.6%
HEARING DISABILITY
99.7/ 100
METRIC RATING
32nd/ 347
METRIC RANK
3.8%
HEARING DISABILITY
0.0/ 100
METRIC RATING
307th/ 347
METRIC RANK
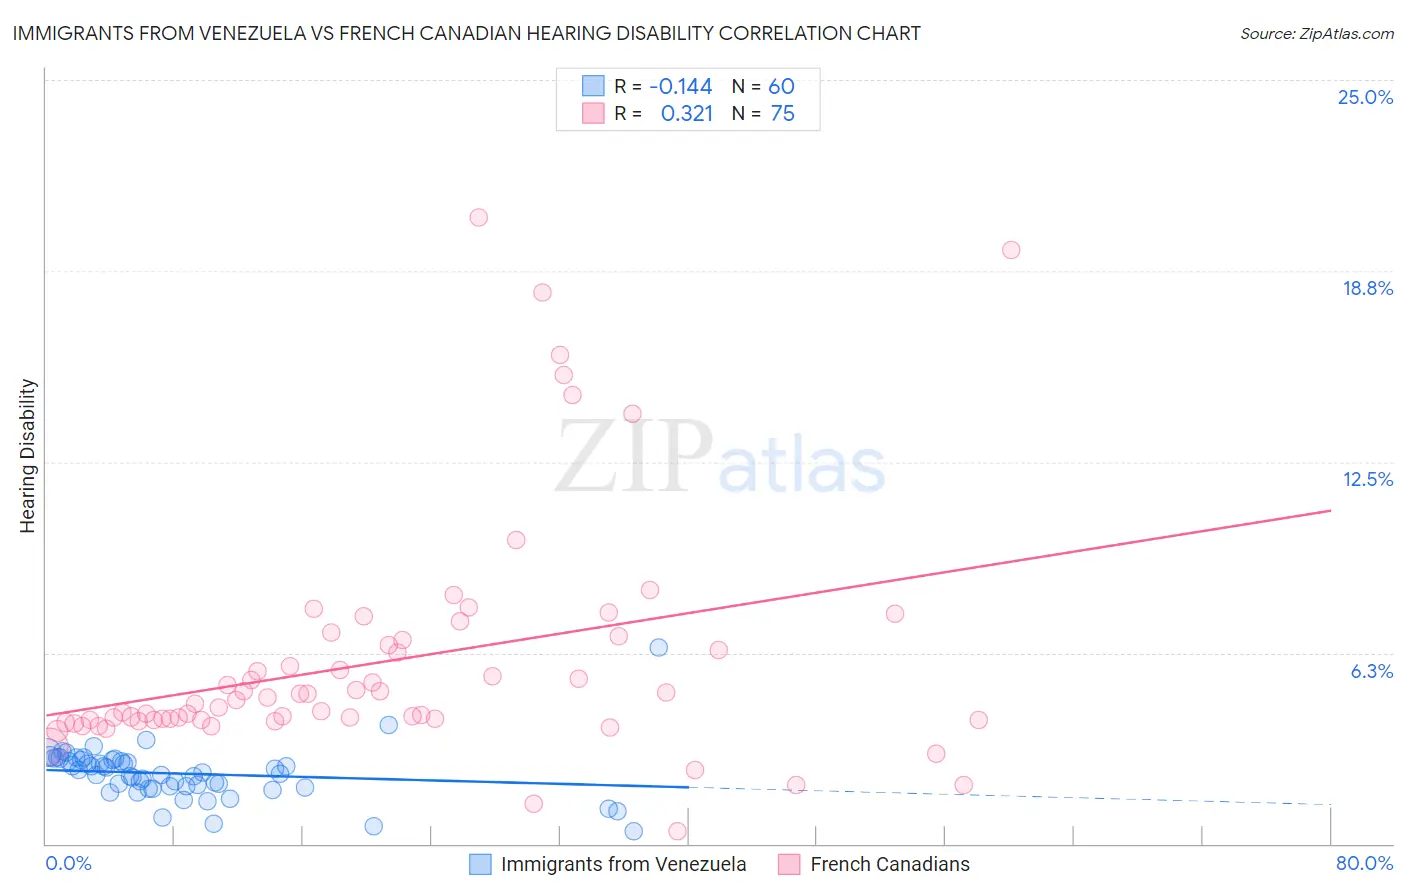
Immigrants from Venezuela vs French Canadian Hearing Disability Correlation Chart
The statistical analysis conducted on geographies consisting of 287,826,264 people shows a poor negative correlation between the proportion of Immigrants from Venezuela and percentage of population with hearing disability in the United States with a correlation coefficient (R) of -0.144 and weighted average of 2.6%. Similarly, the statistical analysis conducted on geographies consisting of 502,335,766 people shows a mild positive correlation between the proportion of French Canadians and percentage of population with hearing disability in the United States with a correlation coefficient (R) of 0.321 and weighted average of 3.8%, a difference of 46.7%.
Hearing Disability Correlation Summary
| Measurement | Immigrants from Venezuela | French Canadian |
| Minimum | 0.40% | 0.39% |
| Maximum | 6.4% | 20.5% |
| Range | 6.0% | 20.1% |
| Mean | 2.3% | 6.0% |
| Median | 2.3% | 4.7% |
| Interquartile 25% (IQ1) | 1.9% | 4.0% |
| Interquartile 75% (IQ3) | 2.7% | 6.7% |
| Interquartile Range (IQR) | 0.89% | 2.6% |
| Standard Deviation (Sample) | 0.88% | 3.9% |
| Standard Deviation (Population) | 0.87% | 3.9% |
Similar Demographics by Hearing Disability
Demographics Similar to Immigrants from Venezuela by Hearing Disability
In terms of hearing disability, the demographic groups most similar to Immigrants from Venezuela are Immigrants from Cameroon (2.6%, a difference of 0.14%), Immigrants from Caribbean (2.6%, a difference of 0.16%), Bolivian (2.6%, a difference of 0.23%), Immigrants from Haiti (2.6%, a difference of 0.26%), and Filipino (2.6%, a difference of 0.26%).
| Demographics | Rating | Rank | Hearing Disability |
| Immigrants | El Salvador | 99.7 /100 | #25 | Exceptional 2.6% |
| Immigrants | Senegal | 99.7 /100 | #26 | Exceptional 2.6% |
| Immigrants | South Central Asia | 99.7 /100 | #27 | Exceptional 2.6% |
| Immigrants | Haiti | 99.7 /100 | #28 | Exceptional 2.6% |
| Bolivians | 99.7 /100 | #29 | Exceptional 2.6% |
| Immigrants | Caribbean | 99.7 /100 | #30 | Exceptional 2.6% |
| Immigrants | Cameroon | 99.7 /100 | #31 | Exceptional 2.6% |
| Immigrants | Venezuela | 99.7 /100 | #32 | Exceptional 2.6% |
| Filipinos | 99.6 /100 | #33 | Exceptional 2.6% |
| Immigrants | Pakistan | 99.6 /100 | #34 | Exceptional 2.6% |
| Salvadorans | 99.6 /100 | #35 | Exceptional 2.6% |
| Okinawans | 99.6 /100 | #36 | Exceptional 2.6% |
| Immigrants | Western Africa | 99.6 /100 | #37 | Exceptional 2.6% |
| Immigrants | Jamaica | 99.5 /100 | #38 | Exceptional 2.6% |
| Immigrants | China | 99.5 /100 | #39 | Exceptional 2.6% |
Demographics Similar to French Canadians by Hearing Disability
In terms of hearing disability, the demographic groups most similar to French Canadians are Marshallese (3.8%, a difference of 0.12%), Ottawa (3.8%, a difference of 0.44%), Scotch-Irish (3.8%, a difference of 0.52%), Cree (3.8%, a difference of 0.83%), and English (3.8%, a difference of 0.98%).
| Demographics | Rating | Rank | Hearing Disability |
| Scottish | 0.0 /100 | #300 | Tragic 3.7% |
| Pennsylvania Germans | 0.0 /100 | #301 | Tragic 3.7% |
| Dutch | 0.0 /100 | #302 | Tragic 3.7% |
| Menominee | 0.0 /100 | #303 | Tragic 3.7% |
| French | 0.0 /100 | #304 | Tragic 3.8% |
| English | 0.0 /100 | #305 | Tragic 3.8% |
| Marshallese | 0.0 /100 | #306 | Tragic 3.8% |
| French Canadians | 0.0 /100 | #307 | Tragic 3.8% |
| Ottawa | 0.0 /100 | #308 | Tragic 3.8% |
| Scotch-Irish | 0.0 /100 | #309 | Tragic 3.8% |
| Cree | 0.0 /100 | #310 | Tragic 3.8% |
| Americans | 0.0 /100 | #311 | Tragic 3.9% |
| Cajuns | 0.0 /100 | #312 | Tragic 3.9% |
| Hopi | 0.0 /100 | #313 | Tragic 3.9% |
| Yakama | 0.0 /100 | #314 | Tragic 3.9% |