Immigrants from Venezuela vs Yup'ik Hearing Disability
COMPARE
Immigrants from Venezuela
Yup'ik
Hearing Disability
Hearing Disability Comparison
Immigrants from Venezuela
Yup'ik
2.6%
HEARING DISABILITY
99.7/ 100
METRIC RATING
32nd/ 347
METRIC RANK
5.8%
HEARING DISABILITY
0.0/ 100
METRIC RATING
347th/ 347
METRIC RANK
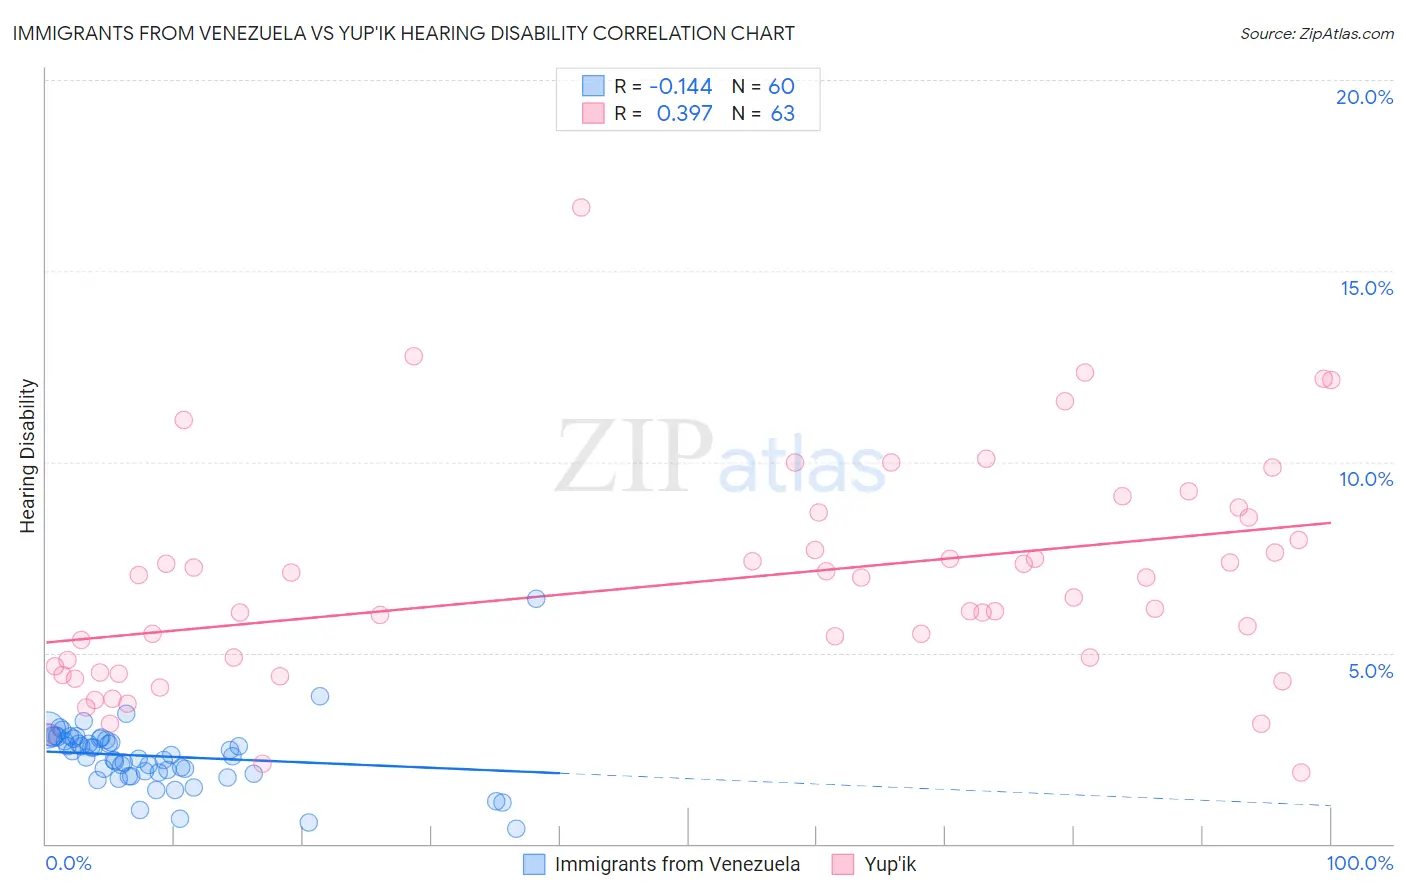
Immigrants from Venezuela vs Yup'ik Hearing Disability Correlation Chart
The statistical analysis conducted on geographies consisting of 287,826,264 people shows a poor negative correlation between the proportion of Immigrants from Venezuela and percentage of population with hearing disability in the United States with a correlation coefficient (R) of -0.144 and weighted average of 2.6%. Similarly, the statistical analysis conducted on geographies consisting of 39,958,202 people shows a mild positive correlation between the proportion of Yup'ik and percentage of population with hearing disability in the United States with a correlation coefficient (R) of 0.397 and weighted average of 5.8%, a difference of 124.9%.
Hearing Disability Correlation Summary
| Measurement | Immigrants from Venezuela | Yup'ik |
| Minimum | 0.40% | 1.9% |
| Maximum | 6.4% | 16.7% |
| Range | 6.0% | 14.8% |
| Mean | 2.3% | 6.8% |
| Median | 2.3% | 6.5% |
| Interquartile 25% (IQ1) | 1.9% | 4.5% |
| Interquartile 75% (IQ3) | 2.7% | 8.5% |
| Interquartile Range (IQR) | 0.89% | 4.1% |
| Standard Deviation (Sample) | 0.88% | 2.9% |
| Standard Deviation (Population) | 0.87% | 2.9% |
Similar Demographics by Hearing Disability
Demographics Similar to Immigrants from Venezuela by Hearing Disability
In terms of hearing disability, the demographic groups most similar to Immigrants from Venezuela are Immigrants from Cameroon (2.6%, a difference of 0.14%), Immigrants from Caribbean (2.6%, a difference of 0.16%), Bolivian (2.6%, a difference of 0.23%), Immigrants from Haiti (2.6%, a difference of 0.26%), and Filipino (2.6%, a difference of 0.26%).
| Demographics | Rating | Rank | Hearing Disability |
| Immigrants | El Salvador | 99.7 /100 | #25 | Exceptional 2.6% |
| Immigrants | Senegal | 99.7 /100 | #26 | Exceptional 2.6% |
| Immigrants | South Central Asia | 99.7 /100 | #27 | Exceptional 2.6% |
| Immigrants | Haiti | 99.7 /100 | #28 | Exceptional 2.6% |
| Bolivians | 99.7 /100 | #29 | Exceptional 2.6% |
| Immigrants | Caribbean | 99.7 /100 | #30 | Exceptional 2.6% |
| Immigrants | Cameroon | 99.7 /100 | #31 | Exceptional 2.6% |
| Immigrants | Venezuela | 99.7 /100 | #32 | Exceptional 2.6% |
| Filipinos | 99.6 /100 | #33 | Exceptional 2.6% |
| Immigrants | Pakistan | 99.6 /100 | #34 | Exceptional 2.6% |
| Salvadorans | 99.6 /100 | #35 | Exceptional 2.6% |
| Okinawans | 99.6 /100 | #36 | Exceptional 2.6% |
| Immigrants | Western Africa | 99.6 /100 | #37 | Exceptional 2.6% |
| Immigrants | Jamaica | 99.5 /100 | #38 | Exceptional 2.6% |
| Immigrants | China | 99.5 /100 | #39 | Exceptional 2.6% |
Demographics Similar to Yup'ik by Hearing Disability
In terms of hearing disability, the demographic groups most similar to Yup'ik are Colville (5.3%, a difference of 9.3%), Alaskan Athabascan (5.3%, a difference of 9.7%), Tlingit-Haida (4.8%, a difference of 20.6%), Inupiat (4.7%, a difference of 23.9%), and Tsimshian (4.7%, a difference of 24.2%).
| Demographics | Rating | Rank | Hearing Disability |
| Dutch West Indians | 0.0 /100 | #333 | Tragic 4.3% |
| Aleuts | 0.0 /100 | #334 | Tragic 4.3% |
| Kiowa | 0.0 /100 | #335 | Tragic 4.3% |
| Creek | 0.0 /100 | #336 | Tragic 4.4% |
| Chickasaw | 0.0 /100 | #337 | Tragic 4.5% |
| Alaska Natives | 0.0 /100 | #338 | Tragic 4.5% |
| Choctaw | 0.0 /100 | #339 | Tragic 4.5% |
| Pueblo | 0.0 /100 | #340 | Tragic 4.6% |
| Navajo | 0.0 /100 | #341 | Tragic 4.6% |
| Tsimshian | 0.0 /100 | #342 | Tragic 4.7% |
| Inupiat | 0.0 /100 | #343 | Tragic 4.7% |
| Tlingit-Haida | 0.0 /100 | #344 | Tragic 4.8% |
| Alaskan Athabascans | 0.0 /100 | #345 | Tragic 5.3% |
| Colville | 0.0 /100 | #346 | Tragic 5.3% |
| Yup'ik | 0.0 /100 | #347 | Tragic 5.8% |