Immigrants from Uganda vs West Indian Unemployment Among Seniors over 65 years
COMPARE
Immigrants from Uganda
West Indian
Unemployment Among Seniors over 65 years
Unemployment Among Seniors over 65 years Comparison
Immigrants from Uganda
West Indians
4.8%
UNEMPLOYMENT AMONG SENIORS OVER 65 YEARS
100.0/ 100
METRIC RATING
31st/ 347
METRIC RANK
5.4%
UNEMPLOYMENT AMONG SENIORS OVER 65 YEARS
0.6/ 100
METRIC RATING
251st/ 347
METRIC RANK
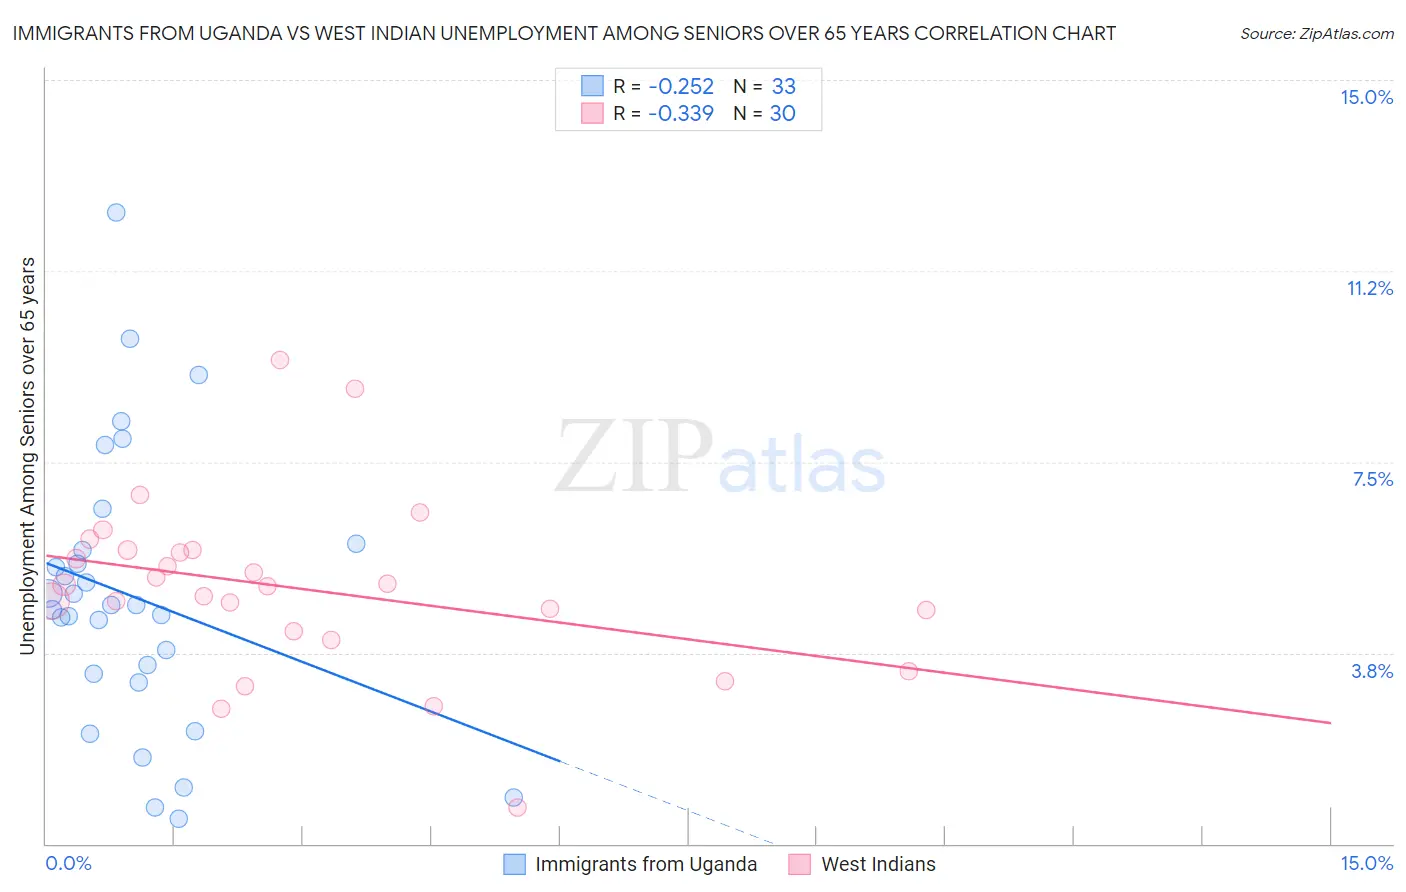
Immigrants from Uganda vs West Indian Unemployment Among Seniors over 65 years Correlation Chart
The statistical analysis conducted on geographies consisting of 122,100,264 people shows a weak negative correlation between the proportion of Immigrants from Uganda and unemployment rate amomg seniors over the age of 65 in the United States with a correlation coefficient (R) of -0.252 and weighted average of 4.8%. Similarly, the statistical analysis conducted on geographies consisting of 238,071,807 people shows a mild negative correlation between the proportion of West Indians and unemployment rate amomg seniors over the age of 65 in the United States with a correlation coefficient (R) of -0.339 and weighted average of 5.4%, a difference of 11.4%.
Unemployment Among Seniors over 65 years Correlation Summary
| Measurement | Immigrants from Uganda | West Indian |
| Minimum | 0.50% | 0.70% |
| Maximum | 12.4% | 9.5% |
| Range | 11.9% | 8.8% |
| Mean | 4.8% | 5.0% |
| Median | 4.7% | 5.1% |
| Interquartile 25% (IQ1) | 3.3% | 4.2% |
| Interquartile 75% (IQ3) | 5.8% | 5.8% |
| Interquartile Range (IQR) | 2.6% | 1.6% |
| Standard Deviation (Sample) | 2.7% | 1.7% |
| Standard Deviation (Population) | 2.7% | 1.7% |
Similar Demographics by Unemployment Among Seniors over 65 years
Demographics Similar to Immigrants from Uganda by Unemployment Among Seniors over 65 years
In terms of unemployment among seniors over 65 years, the demographic groups most similar to Immigrants from Uganda are Slovene (4.8%, a difference of 0.0%), Palestinian (4.8%, a difference of 0.090%), Belgian (4.8%, a difference of 0.20%), Bhutanese (4.8%, a difference of 0.43%), and Immigrants from Kuwait (4.8%, a difference of 0.45%).
| Demographics | Rating | Rank | Unemployment Among Seniors over 65 years |
| Iraqis | 100.0 /100 | #24 | Exceptional 4.7% |
| Tongans | 100.0 /100 | #25 | Exceptional 4.7% |
| Immigrants | Lebanon | 100.0 /100 | #26 | Exceptional 4.8% |
| Houma | 100.0 /100 | #27 | Exceptional 4.8% |
| Ugandans | 100.0 /100 | #28 | Exceptional 4.8% |
| Immigrants | North Macedonia | 100.0 /100 | #29 | Exceptional 4.8% |
| Belgians | 100.0 /100 | #30 | Exceptional 4.8% |
| Immigrants | Uganda | 100.0 /100 | #31 | Exceptional 4.8% |
| Slovenes | 100.0 /100 | #32 | Exceptional 4.8% |
| Palestinians | 100.0 /100 | #33 | Exceptional 4.8% |
| Bhutanese | 100.0 /100 | #34 | Exceptional 4.8% |
| Immigrants | Kuwait | 100.0 /100 | #35 | Exceptional 4.8% |
| Cambodians | 100.0 /100 | #36 | Exceptional 4.8% |
| Bulgarians | 99.9 /100 | #37 | Exceptional 4.8% |
| Immigrants | India | 99.9 /100 | #38 | Exceptional 4.8% |
Demographics Similar to West Indians by Unemployment Among Seniors over 65 years
In terms of unemployment among seniors over 65 years, the demographic groups most similar to West Indians are Immigrants (5.4%, a difference of 0.010%), Ghanaian (5.4%, a difference of 0.010%), French Canadian (5.4%, a difference of 0.030%), Trinidadian and Tobagonian (5.4%, a difference of 0.070%), and Immigrants from Caribbean (5.3%, a difference of 0.090%).
| Demographics | Rating | Rank | Unemployment Among Seniors over 65 years |
| Peruvians | 0.8 /100 | #244 | Tragic 5.3% |
| Ottawa | 0.8 /100 | #245 | Tragic 5.3% |
| Colombians | 0.7 /100 | #246 | Tragic 5.3% |
| Immigrants | Caribbean | 0.7 /100 | #247 | Tragic 5.3% |
| French Canadians | 0.7 /100 | #248 | Tragic 5.4% |
| Immigrants | Immigrants | 0.6 /100 | #249 | Tragic 5.4% |
| Ghanaians | 0.6 /100 | #250 | Tragic 5.4% |
| West Indians | 0.6 /100 | #251 | Tragic 5.4% |
| Trinidadians and Tobagonians | 0.6 /100 | #252 | Tragic 5.4% |
| Immigrants | Sierra Leone | 0.6 /100 | #253 | Tragic 5.4% |
| Paraguayans | 0.5 /100 | #254 | Tragic 5.4% |
| Immigrants | Peru | 0.5 /100 | #255 | Tragic 5.4% |
| Moroccans | 0.5 /100 | #256 | Tragic 5.4% |
| Immigrants | Micronesia | 0.4 /100 | #257 | Tragic 5.4% |
| Sierra Leoneans | 0.4 /100 | #258 | Tragic 5.4% |