Immigrants from Netherlands vs Taiwanese Disability
COMPARE
Immigrants from Netherlands
Taiwanese
Disability
Disability Comparison
Immigrants from Netherlands
Taiwanese
11.6%
DISABILITY
69.8/ 100
METRIC RATING
155th/ 347
METRIC RANK
10.8%
DISABILITY
99.9/ 100
METRIC RATING
47th/ 347
METRIC RANK
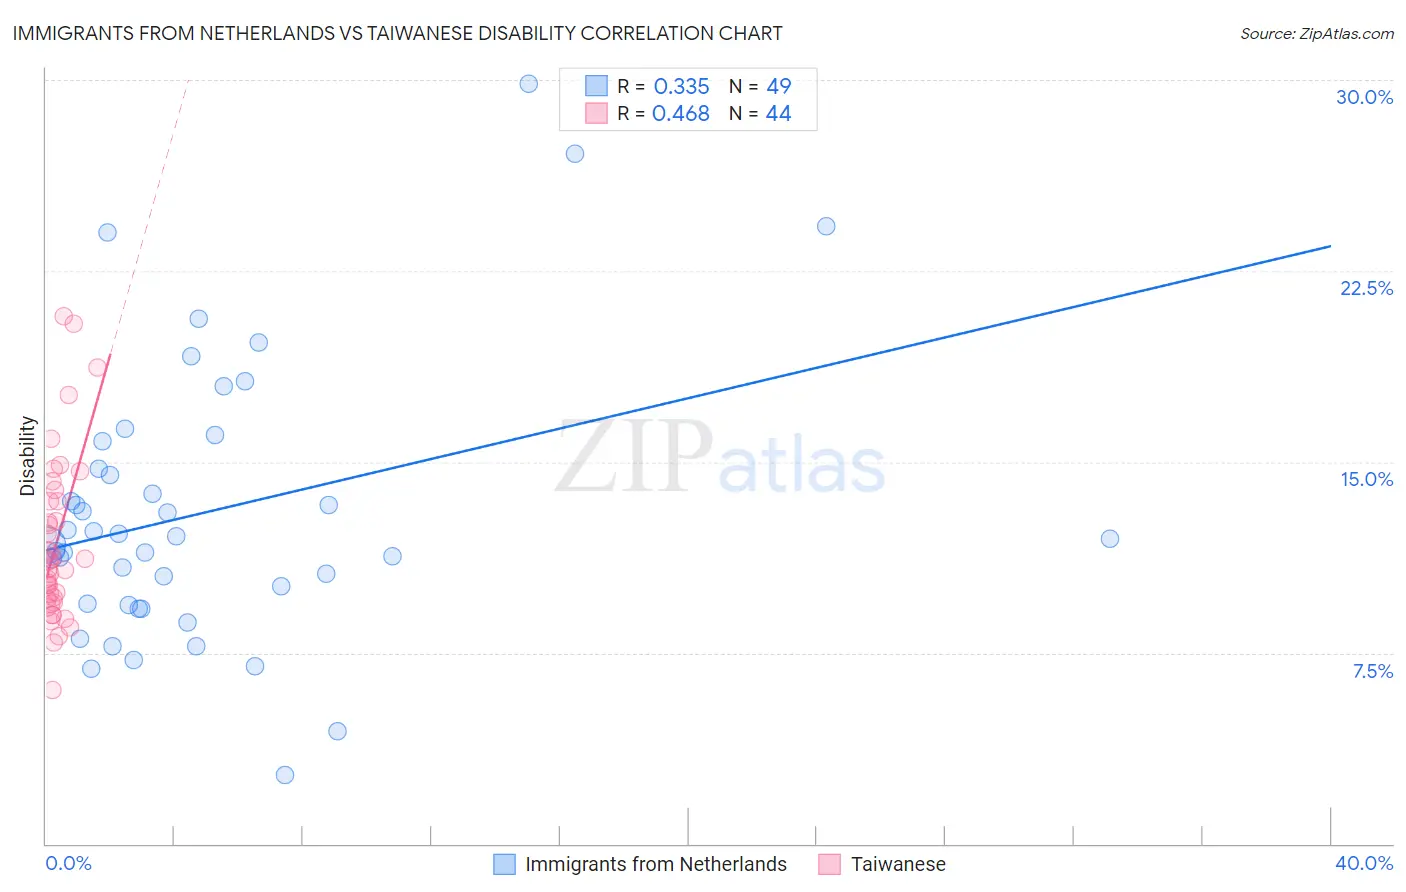
Immigrants from Netherlands vs Taiwanese Disability Correlation Chart
The statistical analysis conducted on geographies consisting of 237,881,665 people shows a mild positive correlation between the proportion of Immigrants from Netherlands and percentage of population with a disability in the United States with a correlation coefficient (R) of 0.335 and weighted average of 11.6%. Similarly, the statistical analysis conducted on geographies consisting of 31,724,936 people shows a moderate positive correlation between the proportion of Taiwanese and percentage of population with a disability in the United States with a correlation coefficient (R) of 0.468 and weighted average of 10.8%, a difference of 7.0%.
Disability Correlation Summary
| Measurement | Immigrants from Netherlands | Taiwanese |
| Minimum | 2.7% | 6.1% |
| Maximum | 29.8% | 20.7% |
| Range | 27.1% | 14.7% |
| Mean | 13.0% | 11.7% |
| Median | 12.0% | 11.0% |
| Interquartile 25% (IQ1) | 9.4% | 9.6% |
| Interquartile 75% (IQ3) | 15.3% | 13.4% |
| Interquartile Range (IQR) | 5.9% | 3.9% |
| Standard Deviation (Sample) | 5.5% | 3.2% |
| Standard Deviation (Population) | 5.4% | 3.2% |
Similar Demographics by Disability
Demographics Similar to Immigrants from Netherlands by Disability
In terms of disability, the demographic groups most similar to Immigrants from Netherlands are Immigrants from Fiji (11.6%, a difference of 0.010%), Immigrants from Middle Africa (11.6%, a difference of 0.020%), Immigrants from Guatemala (11.6%, a difference of 0.070%), Immigrants from Ghana (11.6%, a difference of 0.080%), and Immigrants from Moldova (11.6%, a difference of 0.12%).
| Demographics | Rating | Rank | Disability |
| Sudanese | 77.1 /100 | #148 | Good 11.5% |
| Immigrants | Norway | 73.2 /100 | #149 | Good 11.6% |
| Romanians | 72.7 /100 | #150 | Good 11.6% |
| Immigrants | Kenya | 72.1 /100 | #151 | Good 11.6% |
| Immigrants | Moldova | 72.0 /100 | #152 | Good 11.6% |
| Immigrants | Ghana | 71.2 /100 | #153 | Good 11.6% |
| Immigrants | Guatemala | 71.1 /100 | #154 | Good 11.6% |
| Immigrants | Netherlands | 69.8 /100 | #155 | Good 11.6% |
| Immigrants | Fiji | 69.5 /100 | #156 | Good 11.6% |
| Immigrants | Middle Africa | 69.5 /100 | #157 | Good 11.6% |
| Armenians | 65.9 /100 | #158 | Good 11.6% |
| Guatemalans | 65.1 /100 | #159 | Good 11.6% |
| Immigrants | Barbados | 64.2 /100 | #160 | Good 11.6% |
| Immigrants | Cuba | 62.8 /100 | #161 | Good 11.6% |
| Immigrants | Haiti | 59.2 /100 | #162 | Average 11.7% |
Demographics Similar to Taiwanese by Disability
In terms of disability, the demographic groups most similar to Taiwanese are Tongan (10.8%, a difference of 0.010%), Immigrants from Peru (10.8%, a difference of 0.020%), Soviet Union (10.9%, a difference of 0.19%), Vietnamese (10.9%, a difference of 0.25%), and Immigrants from Saudi Arabia (10.9%, a difference of 0.25%).
| Demographics | Rating | Rank | Disability |
| Mongolians | 99.9 /100 | #40 | Exceptional 10.8% |
| Immigrants | Australia | 99.9 /100 | #41 | Exceptional 10.8% |
| Immigrants | Nepal | 99.9 /100 | #42 | Exceptional 10.8% |
| Israelis | 99.9 /100 | #43 | Exceptional 10.8% |
| Immigrants | Japan | 99.9 /100 | #44 | Exceptional 10.8% |
| Immigrants | Peru | 99.9 /100 | #45 | Exceptional 10.8% |
| Tongans | 99.9 /100 | #46 | Exceptional 10.8% |
| Taiwanese | 99.9 /100 | #47 | Exceptional 10.8% |
| Soviet Union | 99.9 /100 | #48 | Exceptional 10.9% |
| Vietnamese | 99.9 /100 | #49 | Exceptional 10.9% |
| Immigrants | Saudi Arabia | 99.9 /100 | #50 | Exceptional 10.9% |
| Peruvians | 99.8 /100 | #51 | Exceptional 10.9% |
| South Americans | 99.8 /100 | #52 | Exceptional 10.9% |
| Immigrants | Spain | 99.8 /100 | #53 | Exceptional 10.9% |
| Jordanians | 99.8 /100 | #54 | Exceptional 10.9% |