Immigrants from Armenia vs Immigrants from Western Asia Cognitive Disability
COMPARE
Immigrants from Armenia
Immigrants from Western Asia
Cognitive Disability
Cognitive Disability Comparison
Immigrants from Armenia
Immigrants from Western Asia
17.9%
COGNITIVE DISABILITY
0.6/ 100
METRIC RATING
258th/ 347
METRIC RANK
17.4%
COGNITIVE DISABILITY
29.5/ 100
METRIC RATING
189th/ 347
METRIC RANK
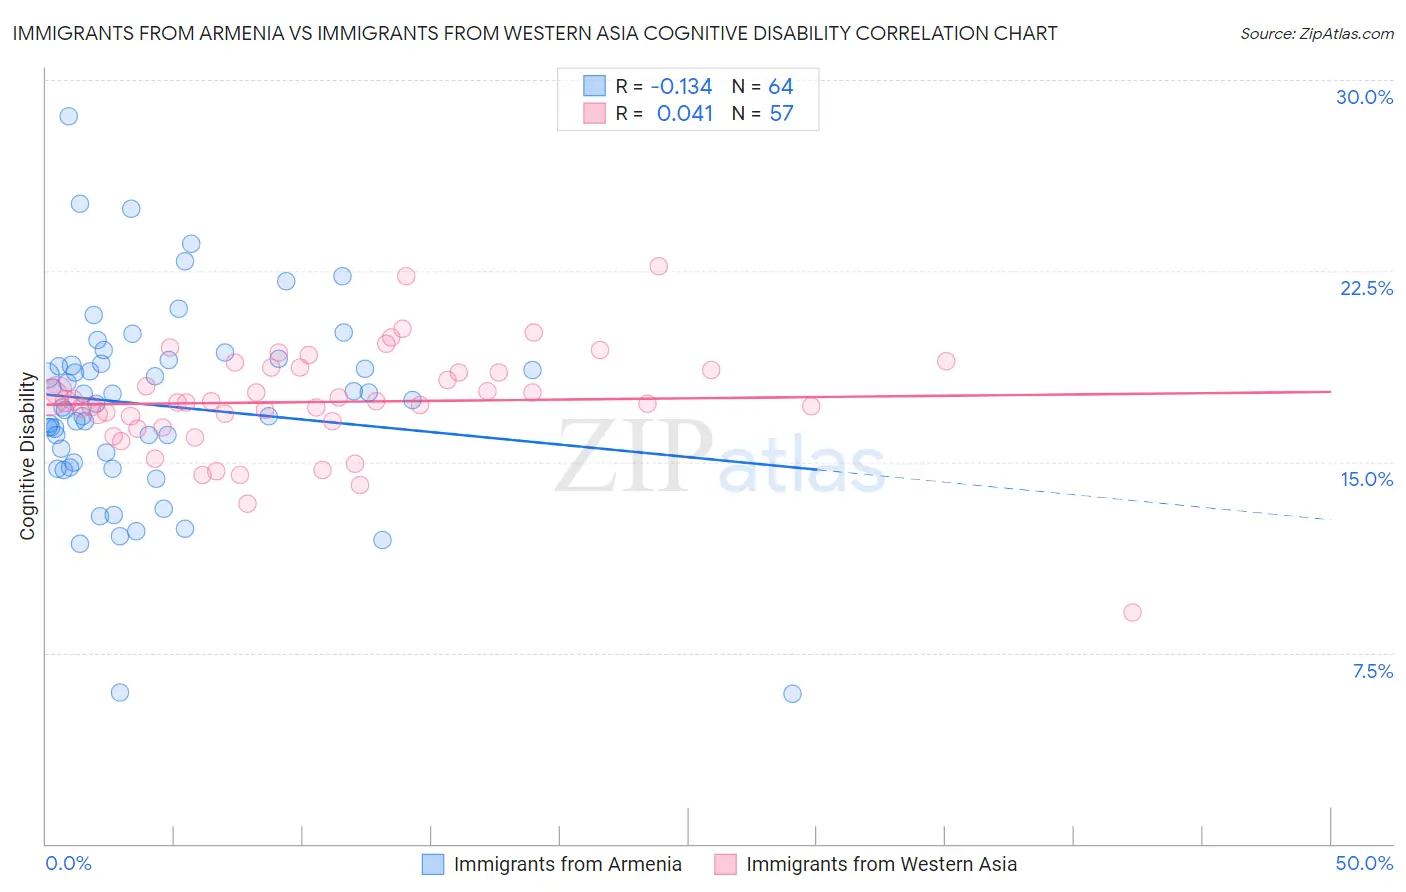
Immigrants from Armenia vs Immigrants from Western Asia Cognitive Disability Correlation Chart
The statistical analysis conducted on geographies consisting of 97,717,666 people shows a poor negative correlation between the proportion of Immigrants from Armenia and percentage of population with cognitive disability in the United States with a correlation coefficient (R) of -0.134 and weighted average of 17.9%. Similarly, the statistical analysis conducted on geographies consisting of 404,418,073 people shows no correlation between the proportion of Immigrants from Western Asia and percentage of population with cognitive disability in the United States with a correlation coefficient (R) of 0.041 and weighted average of 17.4%, a difference of 3.0%.
Cognitive Disability Correlation Summary
| Measurement | Immigrants from Armenia | Immigrants from Western Asia |
| Minimum | 5.9% | 9.1% |
| Maximum | 28.6% | 22.7% |
| Range | 22.7% | 13.6% |
| Mean | 17.2% | 17.4% |
| Median | 17.4% | 17.4% |
| Interquartile 25% (IQ1) | 15.2% | 16.5% |
| Interquartile 75% (IQ3) | 18.9% | 18.7% |
| Interquartile Range (IQR) | 3.8% | 2.2% |
| Standard Deviation (Sample) | 3.9% | 2.1% |
| Standard Deviation (Population) | 3.9% | 2.1% |
Similar Demographics by Cognitive Disability
Demographics Similar to Immigrants from Armenia by Cognitive Disability
In terms of cognitive disability, the demographic groups most similar to Immigrants from Armenia are Mexican American Indian (17.9%, a difference of 0.010%), Immigrants from the Azores (17.9%, a difference of 0.050%), Bahamian (17.9%, a difference of 0.050%), Hopi (17.9%, a difference of 0.060%), and Hispanic or Latino (17.9%, a difference of 0.060%).
| Demographics | Rating | Rank | Cognitive Disability |
| Malaysians | 0.6 /100 | #251 | Tragic 17.9% |
| Immigrants | Grenada | 0.6 /100 | #252 | Tragic 17.9% |
| Hopi | 0.6 /100 | #253 | Tragic 17.9% |
| Hispanics or Latinos | 0.6 /100 | #254 | Tragic 17.9% |
| Immigrants | Azores | 0.6 /100 | #255 | Tragic 17.9% |
| Bahamians | 0.6 /100 | #256 | Tragic 17.9% |
| Mexican American Indians | 0.6 /100 | #257 | Tragic 17.9% |
| Immigrants | Armenia | 0.6 /100 | #258 | Tragic 17.9% |
| Ethiopians | 0.5 /100 | #259 | Tragic 17.9% |
| Immigrants | Belize | 0.5 /100 | #260 | Tragic 17.9% |
| Guamanians/Chamorros | 0.5 /100 | #261 | Tragic 17.9% |
| Sierra Leoneans | 0.4 /100 | #262 | Tragic 17.9% |
| Immigrants | Barbados | 0.4 /100 | #263 | Tragic 17.9% |
| Menominee | 0.4 /100 | #264 | Tragic 18.0% |
| Spanish Americans | 0.4 /100 | #265 | Tragic 18.0% |
Demographics Similar to Immigrants from Western Asia by Cognitive Disability
In terms of cognitive disability, the demographic groups most similar to Immigrants from Western Asia are Immigrants from France (17.4%, a difference of 0.010%), Immigrants from Spain (17.4%, a difference of 0.060%), Nonimmigrants (17.4%, a difference of 0.070%), Immigrants from Haiti (17.4%, a difference of 0.080%), and Immigrants from Fiji (17.4%, a difference of 0.14%).
| Demographics | Rating | Rank | Cognitive Disability |
| Arabs | 42.8 /100 | #182 | Average 17.3% |
| Spaniards | 40.3 /100 | #183 | Average 17.3% |
| Crow | 39.1 /100 | #184 | Fair 17.3% |
| Afghans | 38.2 /100 | #185 | Fair 17.3% |
| Cambodians | 35.9 /100 | #186 | Fair 17.3% |
| Immigrants | Fiji | 33.7 /100 | #187 | Fair 17.4% |
| Immigrants | France | 29.8 /100 | #188 | Fair 17.4% |
| Immigrants | Western Asia | 29.5 /100 | #189 | Fair 17.4% |
| Immigrants | Spain | 27.7 /100 | #190 | Fair 17.4% |
| Immigrants | Nonimmigrants | 27.4 /100 | #191 | Fair 17.4% |
| Immigrants | Haiti | 27.1 /100 | #192 | Fair 17.4% |
| Delaware | 25.6 /100 | #193 | Fair 17.4% |
| Immigrants | Bosnia and Herzegovina | 22.0 /100 | #194 | Fair 17.4% |
| New Zealanders | 21.1 /100 | #195 | Fair 17.4% |
| Guyanese | 17.5 /100 | #196 | Poor 17.5% |