Immigrants from Turkey vs Croatian Female Disability
COMPARE
Immigrants from Turkey
Croatian
Female Disability
Female Disability Comparison
Immigrants from Turkey
Croatians
11.1%
FEMALE DISABILITY
100.0/ 100
METRIC RATING
27th/ 347
METRIC RANK
12.4%
FEMALE DISABILITY
20.2/ 100
METRIC RATING
207th/ 347
METRIC RANK
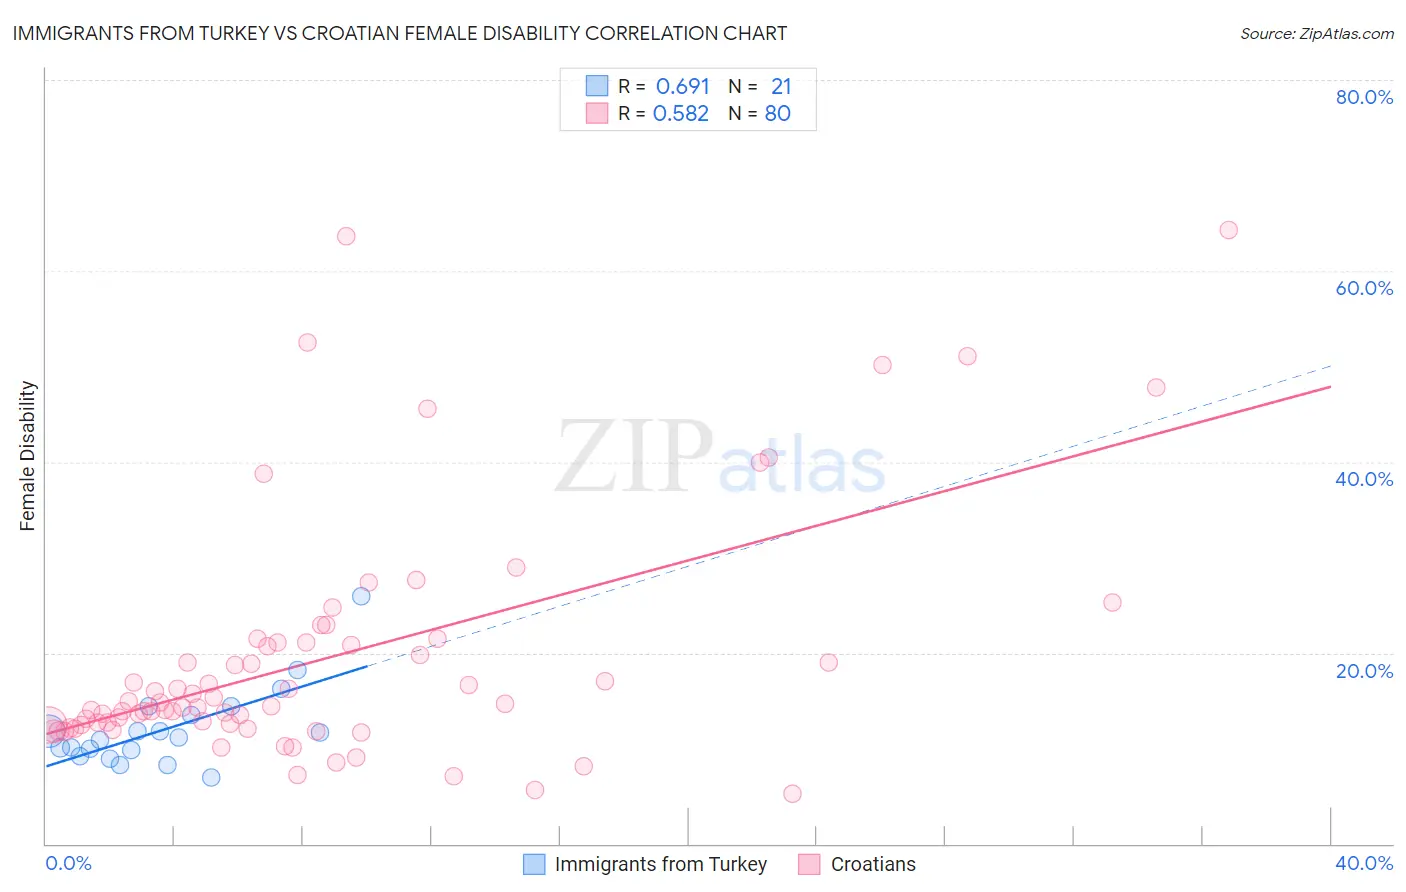
Immigrants from Turkey vs Croatian Female Disability Correlation Chart
The statistical analysis conducted on geographies consisting of 223,044,137 people shows a significant positive correlation between the proportion of Immigrants from Turkey and percentage of females with a disability in the United States with a correlation coefficient (R) of 0.691 and weighted average of 11.1%. Similarly, the statistical analysis conducted on geographies consisting of 375,696,225 people shows a substantial positive correlation between the proportion of Croatians and percentage of females with a disability in the United States with a correlation coefficient (R) of 0.582 and weighted average of 12.4%, a difference of 11.7%.
Female Disability Correlation Summary
| Measurement | Immigrants from Turkey | Croatian |
| Minimum | 6.9% | 5.2% |
| Maximum | 25.9% | 64.3% |
| Range | 19.0% | 59.1% |
| Mean | 12.0% | 19.5% |
| Median | 11.2% | 14.5% |
| Interquartile 25% (IQ1) | 9.5% | 12.4% |
| Interquartile 75% (IQ3) | 13.9% | 21.1% |
| Interquartile Range (IQR) | 4.5% | 8.7% |
| Standard Deviation (Sample) | 4.2% | 12.7% |
| Standard Deviation (Population) | 4.1% | 12.6% |
Similar Demographics by Female Disability
Demographics Similar to Immigrants from Turkey by Female Disability
In terms of female disability, the demographic groups most similar to Immigrants from Turkey are Egyptian (11.1%, a difference of 0.27%), Immigrants from Malaysia (11.1%, a difference of 0.34%), Turkish (11.1%, a difference of 0.34%), Argentinean (11.0%, a difference of 0.40%), and Immigrants from Asia (11.0%, a difference of 0.44%).
| Demographics | Rating | Rank | Female Disability |
| Immigrants | Pakistan | 100.0 /100 | #20 | Exceptional 10.9% |
| Asians | 100.0 /100 | #21 | Exceptional 10.9% |
| Immigrants | Sri Lanka | 100.0 /100 | #22 | Exceptional 10.9% |
| Venezuelans | 100.0 /100 | #23 | Exceptional 11.0% |
| Immigrants | Argentina | 100.0 /100 | #24 | Exceptional 11.0% |
| Immigrants | Asia | 100.0 /100 | #25 | Exceptional 11.0% |
| Argentineans | 100.0 /100 | #26 | Exceptional 11.0% |
| Immigrants | Turkey | 100.0 /100 | #27 | Exceptional 11.1% |
| Egyptians | 100.0 /100 | #28 | Exceptional 11.1% |
| Immigrants | Malaysia | 100.0 /100 | #29 | Exceptional 11.1% |
| Turks | 100.0 /100 | #30 | Exceptional 11.1% |
| Immigrants | Kuwait | 100.0 /100 | #31 | Exceptional 11.1% |
| Immigrants | Australia | 100.0 /100 | #32 | Exceptional 11.1% |
| Immigrants | Egypt | 100.0 /100 | #33 | Exceptional 11.1% |
| Immigrants | Indonesia | 100.0 /100 | #34 | Exceptional 11.2% |
Demographics Similar to Croatians by Female Disability
In terms of female disability, the demographic groups most similar to Croatians are Immigrants from Cuba (12.4%, a difference of 0.0%), Immigrants from Grenada (12.4%, a difference of 0.020%), Immigrants from Zaire (12.3%, a difference of 0.040%), Immigrants from Barbados (12.3%, a difference of 0.050%), and Somali (12.3%, a difference of 0.080%).
| Demographics | Rating | Rank | Female Disability |
| Trinidadians and Tobagonians | 22.4 /100 | #200 | Fair 12.3% |
| Chinese | 22.1 /100 | #201 | Fair 12.3% |
| Somalis | 21.5 /100 | #202 | Fair 12.3% |
| Immigrants | Barbados | 21.1 /100 | #203 | Fair 12.3% |
| Immigrants | Zaire | 20.9 /100 | #204 | Fair 12.3% |
| Immigrants | Grenada | 20.5 /100 | #205 | Fair 12.4% |
| Immigrants | Cuba | 20.2 /100 | #206 | Fair 12.4% |
| Croatians | 20.2 /100 | #207 | Fair 12.4% |
| Basques | 17.5 /100 | #208 | Poor 12.4% |
| Mexicans | 15.7 /100 | #209 | Poor 12.4% |
| Swiss | 14.9 /100 | #210 | Poor 12.4% |
| Immigrants | Bosnia and Herzegovina | 14.8 /100 | #211 | Poor 12.4% |
| Ute | 14.7 /100 | #212 | Poor 12.4% |
| Immigrants | Thailand | 14.5 /100 | #213 | Poor 12.4% |
| Panamanians | 13.5 /100 | #214 | Poor 12.4% |