Immigrants from Turkey vs Polish Female Disability
COMPARE
Immigrants from Turkey
Polish
Female Disability
Female Disability Comparison
Immigrants from Turkey
Poles
11.1%
FEMALE DISABILITY
100.0/ 100
METRIC RATING
27th/ 347
METRIC RANK
12.5%
FEMALE DISABILITY
8.4/ 100
METRIC RATING
225th/ 347
METRIC RANK
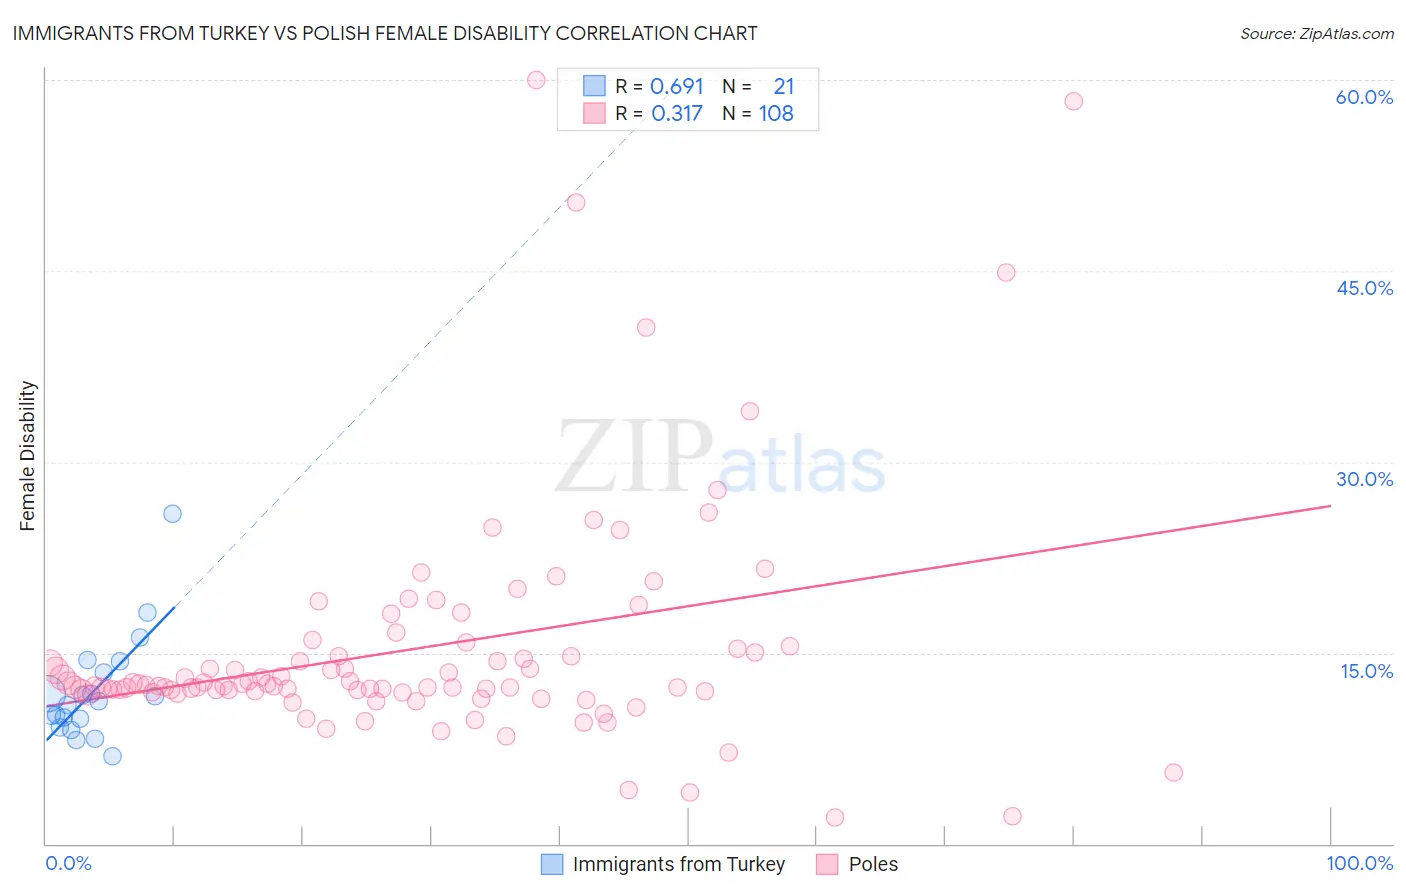
Immigrants from Turkey vs Polish Female Disability Correlation Chart
The statistical analysis conducted on geographies consisting of 223,044,137 people shows a significant positive correlation between the proportion of Immigrants from Turkey and percentage of females with a disability in the United States with a correlation coefficient (R) of 0.691 and weighted average of 11.1%. Similarly, the statistical analysis conducted on geographies consisting of 560,308,086 people shows a mild positive correlation between the proportion of Poles and percentage of females with a disability in the United States with a correlation coefficient (R) of 0.317 and weighted average of 12.5%, a difference of 12.7%.
Female Disability Correlation Summary
| Measurement | Immigrants from Turkey | Polish |
| Minimum | 6.9% | 2.1% |
| Maximum | 25.9% | 60.0% |
| Range | 19.0% | 57.9% |
| Mean | 12.0% | 15.3% |
| Median | 11.2% | 12.4% |
| Interquartile 25% (IQ1) | 9.5% | 11.9% |
| Interquartile 75% (IQ3) | 13.9% | 15.2% |
| Interquartile Range (IQR) | 4.5% | 3.2% |
| Standard Deviation (Sample) | 4.2% | 9.3% |
| Standard Deviation (Population) | 4.1% | 9.3% |
Similar Demographics by Female Disability
Demographics Similar to Immigrants from Turkey by Female Disability
In terms of female disability, the demographic groups most similar to Immigrants from Turkey are Egyptian (11.1%, a difference of 0.27%), Immigrants from Malaysia (11.1%, a difference of 0.34%), Turkish (11.1%, a difference of 0.34%), Argentinean (11.0%, a difference of 0.40%), and Immigrants from Asia (11.0%, a difference of 0.44%).
| Demographics | Rating | Rank | Female Disability |
| Immigrants | Pakistan | 100.0 /100 | #20 | Exceptional 10.9% |
| Asians | 100.0 /100 | #21 | Exceptional 10.9% |
| Immigrants | Sri Lanka | 100.0 /100 | #22 | Exceptional 10.9% |
| Venezuelans | 100.0 /100 | #23 | Exceptional 11.0% |
| Immigrants | Argentina | 100.0 /100 | #24 | Exceptional 11.0% |
| Immigrants | Asia | 100.0 /100 | #25 | Exceptional 11.0% |
| Argentineans | 100.0 /100 | #26 | Exceptional 11.0% |
| Immigrants | Turkey | 100.0 /100 | #27 | Exceptional 11.1% |
| Egyptians | 100.0 /100 | #28 | Exceptional 11.1% |
| Immigrants | Malaysia | 100.0 /100 | #29 | Exceptional 11.1% |
| Turks | 100.0 /100 | #30 | Exceptional 11.1% |
| Immigrants | Kuwait | 100.0 /100 | #31 | Exceptional 11.1% |
| Immigrants | Australia | 100.0 /100 | #32 | Exceptional 11.1% |
| Immigrants | Egypt | 100.0 /100 | #33 | Exceptional 11.1% |
| Immigrants | Indonesia | 100.0 /100 | #34 | Exceptional 11.2% |
Demographics Similar to Poles by Female Disability
In terms of female disability, the demographic groups most similar to Poles are Hispanic or Latino (12.5%, a difference of 0.050%), Assyrian/Chaldean/Syriac (12.5%, a difference of 0.060%), Immigrants from Cambodia (12.5%, a difference of 0.080%), Belizean (12.5%, a difference of 0.10%), and Guamanian/Chamorro (12.5%, a difference of 0.12%).
| Demographics | Rating | Rank | Female Disability |
| Immigrants | Bahamas | 12.5 /100 | #218 | Poor 12.4% |
| Europeans | 12.1 /100 | #219 | Poor 12.4% |
| Bahamians | 11.1 /100 | #220 | Poor 12.4% |
| Native Hawaiians | 10.8 /100 | #221 | Poor 12.4% |
| Italians | 10.7 /100 | #222 | Poor 12.4% |
| Guamanians/Chamorros | 9.5 /100 | #223 | Tragic 12.5% |
| Belizeans | 9.3 /100 | #224 | Tragic 12.5% |
| Poles | 8.4 /100 | #225 | Tragic 12.5% |
| Hispanics or Latinos | 8.0 /100 | #226 | Tragic 12.5% |
| Assyrians/Chaldeans/Syriacs | 8.0 /100 | #227 | Tragic 12.5% |
| Immigrants | Cambodia | 7.8 /100 | #228 | Tragic 12.5% |
| Hungarians | 7.2 /100 | #229 | Tragic 12.5% |
| Immigrants | Belize | 7.0 /100 | #230 | Tragic 12.5% |
| Belgians | 6.5 /100 | #231 | Tragic 12.5% |
| Immigrants | Somalia | 5.9 /100 | #232 | Tragic 12.5% |