Immigrants from Turkey vs Croatian 3rd Grade
COMPARE
Immigrants from Turkey
Croatian
3rd Grade
3rd Grade Comparison
Immigrants from Turkey
Croatians
97.9%
3RD GRADE
83.5/ 100
METRIC RATING
141st/ 347
METRIC RANK
98.5%
3RD GRADE
100.0/ 100
METRIC RATING
27th/ 347
METRIC RANK
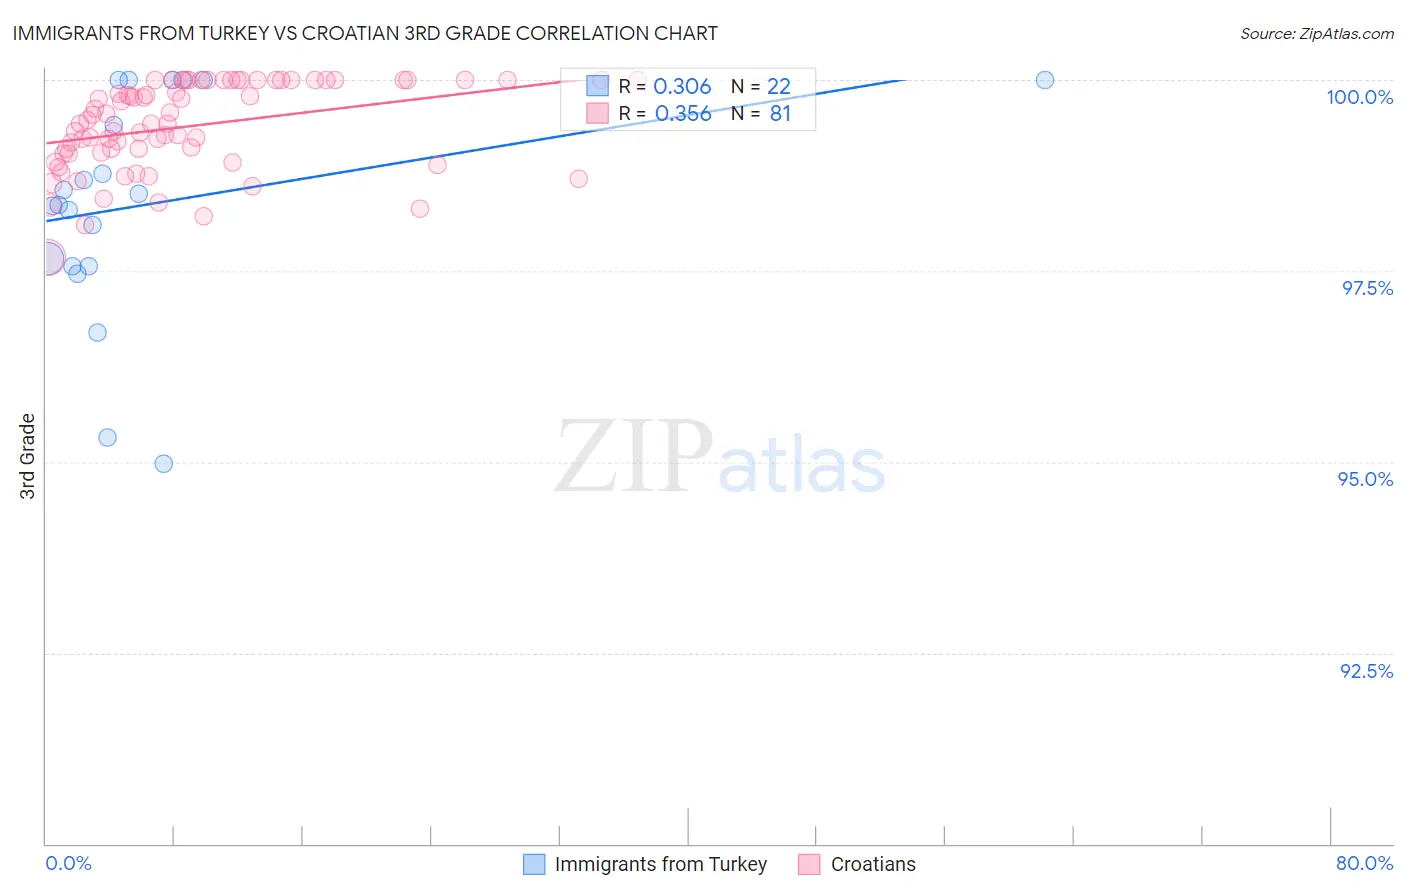
Immigrants from Turkey vs Croatian 3rd Grade Correlation Chart
The statistical analysis conducted on geographies consisting of 223,057,877 people shows a mild positive correlation between the proportion of Immigrants from Turkey and percentage of population with at least 3rd grade education in the United States with a correlation coefficient (R) of 0.306 and weighted average of 97.9%. Similarly, the statistical analysis conducted on geographies consisting of 375,731,938 people shows a mild positive correlation between the proportion of Croatians and percentage of population with at least 3rd grade education in the United States with a correlation coefficient (R) of 0.356 and weighted average of 98.5%, a difference of 0.58%.
3rd Grade Correlation Summary
| Measurement | Immigrants from Turkey | Croatian |
| Minimum | 95.0% | 97.7% |
| Maximum | 100.0% | 100.0% |
| Range | 5.0% | 2.3% |
| Mean | 98.4% | 99.4% |
| Median | 98.4% | 99.4% |
| Interquartile 25% (IQ1) | 97.6% | 99.0% |
| Interquartile 75% (IQ3) | 100.0% | 100.0% |
| Interquartile Range (IQR) | 2.4% | 0.96% |
| Standard Deviation (Sample) | 1.4% | 0.58% |
| Standard Deviation (Population) | 1.4% | 0.57% |
Similar Demographics by 3rd Grade
Demographics Similar to Immigrants from Turkey by 3rd Grade
In terms of 3rd grade, the demographic groups most similar to Immigrants from Turkey are Palestinian (97.9%, a difference of 0.010%), Israeli (97.9%, a difference of 0.020%), Blackfeet (97.9%, a difference of 0.020%), Hmong (97.9%, a difference of 0.020%), and Filipino (97.9%, a difference of 0.020%).
| Demographics | Rating | Rank | 3rd Grade |
| Seminole | 88.7 /100 | #134 | Excellent 97.9% |
| Cambodians | 88.1 /100 | #135 | Excellent 97.9% |
| Spaniards | 87.9 /100 | #136 | Excellent 97.9% |
| Immigrants | Romania | 87.9 /100 | #137 | Excellent 97.9% |
| Israelis | 86.6 /100 | #138 | Excellent 97.9% |
| Blackfeet | 86.3 /100 | #139 | Excellent 97.9% |
| Palestinians | 84.6 /100 | #140 | Excellent 97.9% |
| Immigrants | Turkey | 83.5 /100 | #141 | Excellent 97.9% |
| Hmong | 80.3 /100 | #142 | Excellent 97.9% |
| Filipinos | 79.9 /100 | #143 | Good 97.9% |
| Burmese | 79.6 /100 | #144 | Good 97.9% |
| Immigrants | Greece | 79.5 /100 | #145 | Good 97.9% |
| Alsatians | 78.3 /100 | #146 | Good 97.9% |
| Immigrants | Israel | 77.3 /100 | #147 | Good 97.9% |
| Immigrants | Moldova | 77.1 /100 | #148 | Good 97.9% |
Demographics Similar to Croatians by 3rd Grade
In terms of 3rd grade, the demographic groups most similar to Croatians are Scotch-Irish (98.5%, a difference of 0.010%), Aleut (98.5%, a difference of 0.010%), French (98.4%, a difference of 0.010%), Finnish (98.5%, a difference of 0.020%), and Sioux (98.5%, a difference of 0.020%).
| Demographics | Rating | Rank | 3rd Grade |
| Pennsylvania Germans | 100.0 /100 | #20 | Exceptional 98.5% |
| Lithuanians | 100.0 /100 | #21 | Exceptional 98.5% |
| Finns | 100.0 /100 | #22 | Exceptional 98.5% |
| Sioux | 100.0 /100 | #23 | Exceptional 98.5% |
| Danes | 100.0 /100 | #24 | Exceptional 98.5% |
| Scotch-Irish | 100.0 /100 | #25 | Exceptional 98.5% |
| Aleuts | 100.0 /100 | #26 | Exceptional 98.5% |
| Croatians | 100.0 /100 | #27 | Exceptional 98.5% |
| French | 100.0 /100 | #28 | Exceptional 98.4% |
| French Canadians | 100.0 /100 | #29 | Exceptional 98.4% |
| Europeans | 100.0 /100 | #30 | Exceptional 98.4% |
| Czechs | 100.0 /100 | #31 | Exceptional 98.4% |
| Scandinavians | 100.0 /100 | #32 | Exceptional 98.4% |
| Chinese | 100.0 /100 | #33 | Exceptional 98.4% |
| Swiss | 100.0 /100 | #34 | Exceptional 98.4% |