Immigrants from Thailand vs Osage Ambulatory Disability
COMPARE
Immigrants from Thailand
Osage
Ambulatory Disability
Ambulatory Disability Comparison
Immigrants from Thailand
Osage
6.1%
AMBULATORY DISABILITY
42.2/ 100
METRIC RATING
183rd/ 347
METRIC RANK
7.4%
AMBULATORY DISABILITY
0.0/ 100
METRIC RATING
322nd/ 347
METRIC RANK
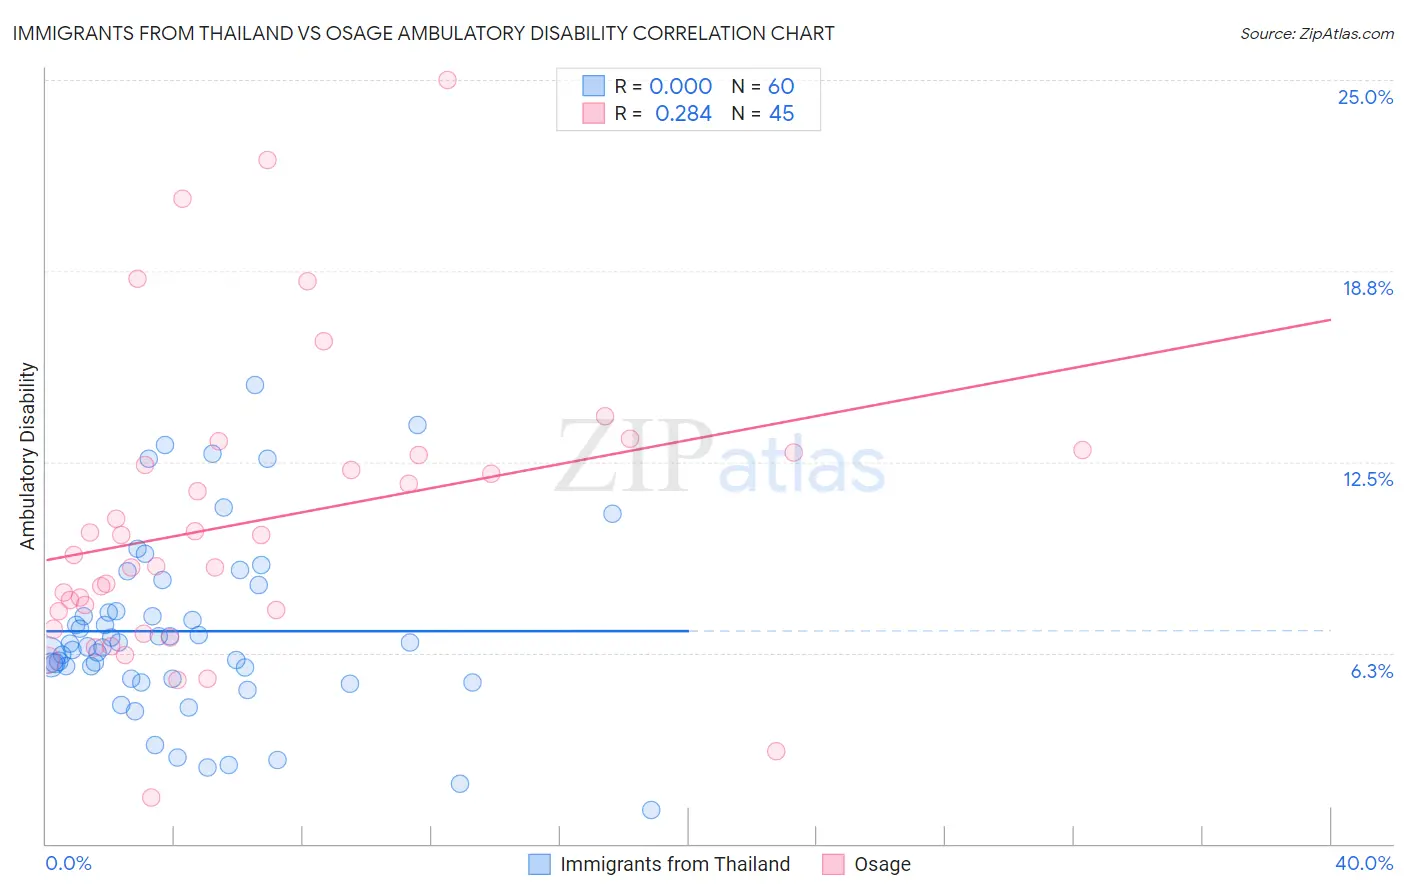
Immigrants from Thailand vs Osage Ambulatory Disability Correlation Chart
The statistical analysis conducted on geographies consisting of 316,957,387 people shows no correlation between the proportion of Immigrants from Thailand and percentage of population with ambulatory disability in the United States with a correlation coefficient (R) of 0.000 and weighted average of 6.1%. Similarly, the statistical analysis conducted on geographies consisting of 91,795,743 people shows a weak positive correlation between the proportion of Osage and percentage of population with ambulatory disability in the United States with a correlation coefficient (R) of 0.284 and weighted average of 7.4%, a difference of 20.3%.
Ambulatory Disability Correlation Summary
| Measurement | Immigrants from Thailand | Osage |
| Minimum | 1.1% | 1.5% |
| Maximum | 15.0% | 25.0% |
| Range | 13.9% | 23.5% |
| Mean | 7.0% | 10.5% |
| Median | 6.5% | 9.5% |
| Interquartile 25% (IQ1) | 5.4% | 7.3% |
| Interquartile 75% (IQ3) | 8.0% | 12.8% |
| Interquartile Range (IQR) | 2.6% | 5.5% |
| Standard Deviation (Sample) | 2.9% | 4.9% |
| Standard Deviation (Population) | 2.9% | 4.8% |
Similar Demographics by Ambulatory Disability
Demographics Similar to Immigrants from Thailand by Ambulatory Disability
In terms of ambulatory disability, the demographic groups most similar to Immigrants from Thailand are Serbian (6.1%, a difference of 0.030%), Swiss (6.1%, a difference of 0.050%), Immigrants from Ghana (6.1%, a difference of 0.050%), Immigrants from Nicaragua (6.1%, a difference of 0.090%), and Austrian (6.1%, a difference of 0.10%).
| Demographics | Rating | Rank | Ambulatory Disability |
| Immigrants | North America | 45.6 /100 | #176 | Average 6.1% |
| Immigrants | England | 45.4 /100 | #177 | Average 6.1% |
| Scandinavians | 44.5 /100 | #178 | Average 6.1% |
| Austrians | 44.1 /100 | #179 | Average 6.1% |
| Immigrants | Nicaragua | 43.9 /100 | #180 | Average 6.1% |
| Swiss | 43.1 /100 | #181 | Average 6.1% |
| Serbians | 42.8 /100 | #182 | Average 6.1% |
| Immigrants | Thailand | 42.2 /100 | #183 | Average 6.1% |
| Immigrants | Ghana | 41.2 /100 | #184 | Average 6.1% |
| Immigrants | Bosnia and Herzegovina | 37.2 /100 | #185 | Fair 6.2% |
| Europeans | 36.2 /100 | #186 | Fair 6.2% |
| Carpatho Rusyns | 35.3 /100 | #187 | Fair 6.2% |
| British | 34.3 /100 | #188 | Fair 6.2% |
| Ukrainians | 34.0 /100 | #189 | Fair 6.2% |
| Immigrants | Western Africa | 33.4 /100 | #190 | Fair 6.2% |
Demographics Similar to Osage by Ambulatory Disability
In terms of ambulatory disability, the demographic groups most similar to Osage are Apache (7.4%, a difference of 0.14%), American (7.4%, a difference of 0.28%), Potawatomi (7.3%, a difference of 0.95%), Navajo (7.5%, a difference of 1.6%), and Comanche (7.5%, a difference of 1.7%).
| Demographics | Rating | Rank | Ambulatory Disability |
| Shoshone | 0.0 /100 | #315 | Tragic 7.1% |
| Immigrants | Dominican Republic | 0.0 /100 | #316 | Tragic 7.1% |
| Central American Indians | 0.0 /100 | #317 | Tragic 7.2% |
| Ottawa | 0.0 /100 | #318 | Tragic 7.2% |
| Dominicans | 0.0 /100 | #319 | Tragic 7.2% |
| Potawatomi | 0.0 /100 | #320 | Tragic 7.3% |
| Apache | 0.0 /100 | #321 | Tragic 7.4% |
| Osage | 0.0 /100 | #322 | Tragic 7.4% |
| Americans | 0.0 /100 | #323 | Tragic 7.4% |
| Navajo | 0.0 /100 | #324 | Tragic 7.5% |
| Comanche | 0.0 /100 | #325 | Tragic 7.5% |
| Blacks/African Americans | 0.0 /100 | #326 | Tragic 7.5% |
| Natives/Alaskans | 0.0 /100 | #327 | Tragic 7.5% |
| Hopi | 0.0 /100 | #328 | Tragic 7.6% |
| Pueblo | 0.0 /100 | #329 | Tragic 7.6% |